Image processing in the Fourier domain is a fundamental tool not only in the process of manipulating and enhancing images but also in image formation. Most computerized imaging modalities rely on the Fourier transform at some point of the image formation process. The following examples of computed tomography and magnetic resonance image formation highlight the importance of the Fourier transform in biomedical imaging.
In 1917, J. Radon presented his work "On the determination of functions through line integrals along certain manifolds."24 X-ray attenuation through inhomogeneous media can be described by
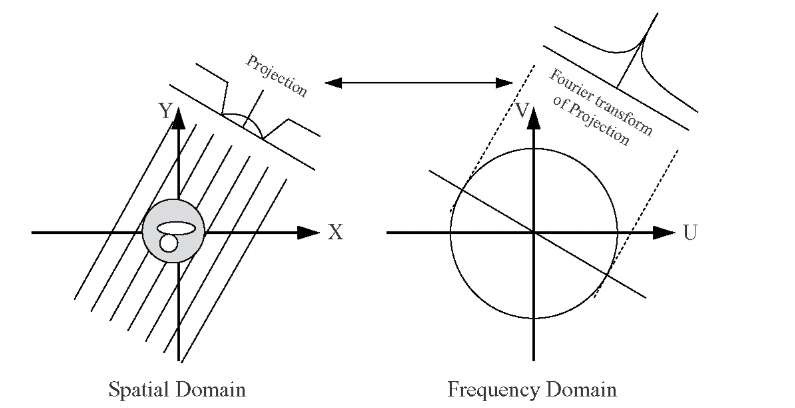
where I0 is the incident x-ray intensity, I the x-ray intensity after the x-rays passed through the object, ^(r) the x-ray absorption at location r, and integration takes place along a straight path s through the object. The argument of the exponential function is a line integral in the sense of Radon’s work, and a set of line integrals along parallel paths that completely covers the object describes an x-ray projection. The set of projections at different angles are referred to as the Radon transform. Radon showed that this is indeed a transform, as an inverse transform exists which allows to recover the original object from the Radon transform. A relationship exists between the Radon and Fourier transforms called the Fourier slice theorem. It stipulates that the Fourier transform of a parallel projection of an image ^(x,y), taken at an angle 0, gives a one-dimensional slice of the two-dimensional Fourier transform of ^(x,y), subtending an angle 0 with the u-axis.18 The Fourier slice theorem is illustrated in Figure 3.13.
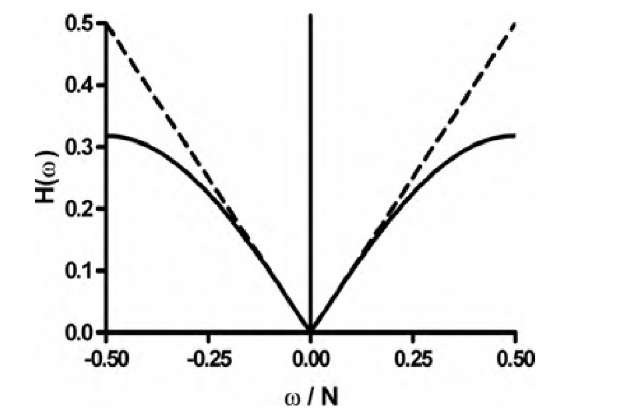
On the basis of the Fourier slice theorem, image reconstruction in computed tomography becomes possible by first collecting one-dimensional projections at many angles. Their one-dimensional Fourier transforms are then entered into a two-dimensional frequency-domain matrix spaceholder. Since it is practically impossible to fill all matrix elements of the frequency-domain matrix, missing elements need to be interpolated. Once the matrix is completely filled and interpolated, the object is obtained by two-dimensional inverse fast Fourier transform of the matrix. An alternative approach for CT reconstruction is filtered backprojection. In the backprojection process, the projection is distributed over the image along the line of projection, and the contributions of the projections at different angles are added up. It can be shown that the point-spread function of the backprojection process is a 1/r function such that a point source blurs into an image with an intensity that drops off with the reciprocal of the distance r to the point center. A suitable filter to correct for the 1/r point-spread function has a frequency response of H(w) = Iwl,15 and a convolution-based filter kernel to achieve this frequency response was proposed by Ramachandran and Lakshminarayanan.25 The filtered backprojection thus becomes a two-step process, where the projection is first convolved with the Ramachandran-Lakshminarayanan kernel and then backprojected over the image space for reconstruction. Since the Fourier transform of this kernel is proportional to IwI, its frequency-domain implementation is much more efficient, and the first step of the filtered backprojection becomes a frequency-domain filtering step where the projection is Fourier-transformed, the transform multiplied with Iwl, and the result subjected to the inverse Fourier transform. This operation has a close relationship to computation of the first derivative:
which has a lower amplification of high spatial frequencies than that of the Ramachandran-Lakshminarayanan filter. This behavior can be seen in Figure 3.14.
FIGURE 3.13 The Fourier slice theorem relates the one-dimensional Fourier transform of a projection to a slice through the two-dimensional Fourier transform of the object along a line through the origin at the same angle as the projection.
Consequently, it has a strong noise-amplifying effect. Shepp and Logan28 therefore suggested a different filter with a frequency response H(w):
FIGURE 3.14 Frequency responses of the filters used in the filtered backprojection for computed tomography reconstruction. The dashed line represents the filter by Ramachandran and Lakshminarayanan, and the solid line represents the filter by Shepp and Logan. The Shepp-Logan filter exhibits less amplification of the higher frequencies, which reduces image noise at the expense of some sharpness.
As a result, the Shepp-Logan filter will cause the reconstructed images to have a lower noise component at the expense of some edge sharpness. Reconstruction in Fourier space and filters for reconstruction are presented in a review paper by Zubal and Wisniewski.36
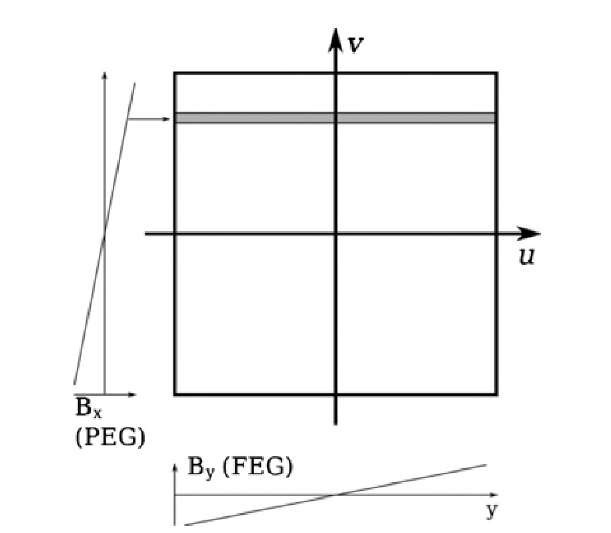
The Fourier transform is of similar importance in the reconstruction of magnetic resonance images. Hydrogen protons possess a magnetic moment. In a strong external magnetic field, the magnetic moments assume an orientation parallel and antiparallel to the magnetic field with a small net magnetization in favor of the parallel orientation. In addition, the magnetic moment shows a small precession with an angular frequency (Larmor frequency) w = 7 B0, where B0 is the external magnetic field and 7 is the gyromagnetic ratio, which is a material constant. In a typical clinical scanner with B0 = 1.5 T, the precession frequency is f = w/2^ = 63.87 MHz. A radio-frequency pulse can be used to expand the precession cone and to bring the precessing moments into coherence. Once the radio-frequency pulse stops, precession coherence is lost, and the precession cone narrows as the magnetic moments return to their original orientation parallel to B0. In the process, the protons emit a decaying radio-frequency signal with their precession frequency that is received by a suitable antenna. To obtain an image, the radio-frequency signal needs to be encoded in three dimensions. Encoding is performed by three orthogonal magnetic gradients that are superimposed over the main magnetic field B0. These gradients change the precession frequency along the axis of the gradient. Analysis of the frequency components by means of the Fourier transform allows spatial separation of the signal components. More precisely, the first gradient is applied in the axial (z) direction during radio-frequency injection. This ensures that precession coherence is achieved in only a thin slice of the tissue. Upon echo acquisition, only this slice contributes to the radio-frequency signal. Between radio-frequency injection and echo acquisition, a brief gradient along the x-axis [Bx, called the phase-encode gradient (PEG)] creates a position-dependent phase shift of the precessing moments along the x-axis. During acquisition, the third gradient is applied, which modulates the precession frequencies along the y-axis [By, called the frequency-encode gradient (FEG)]. Phase shift and echo frequency are orthogonal and can be seen as a point in a two-dimensional frequency-domain matrix called the k-space matrix. Each echo acquisition fills one line parallel to the u-axis of the k-space matrix, and application of the x gradient determines the position of this line on the v-axis. The k-space matrix is filled with repeated acquisitions. An inverse Fourier transform yields the cross-sectional image (Figure 3.15).
FIGURE 3.15 Filling of the k-space matrix in MRI. The frequency encode gradient (FEG) causes different precession frequencies along the y-axis, and Fourier analysis of one single echo signal allows us to fill one line of pixels in the k-space matrix (gray shaded box). The phase encode gradient (PEG) is a gradient along the x-axis that is applied briefly before echo acquisition. Phase encode gradients of different strength can be seen as vectors that position the echo line parallel to the v-axis. Repeated echos, taken with different PEG strengths, are used to fill the k-space matrix line by line. The inverse Fourier transform of the filled k-space matrix yields the cross-sectional image.
Ultrasound imaging is not as fundamentally dependent on the Fourier transform as are CT and MRI, but spectral analysis of the echo signals is a key step in Doppler ultrasound to determine flow velocity. In one example, high transducer frequencies and harmonic analysis in combination with contrast agents provide high-quality images of the liver.33 Since one of the primary advantages of ultrasound imaging is its near-real-time data acquisition, fast execution of the Fourier transform is particularly important. One option to accelerate the FFT further is the implementation in hardware. Hu et al.17 propose a field-programmable gate array (FPGA). An FPGA consists of semiconductor circuits which allow the realization of flexibly programmable sequential logic operations, somewhat analogous to a graphics processor chip, which can be tuned to execute a very limited instruction set at very high speed.
The flexibility of FPGA programming allows us to implement a complete image processing chain (i.e., data collection, demodulation, Fourier transform) in one single chip with an execution time of less than 50 ^s per spectrum.17 A frequently used alternative to accelerate the FFT is to use fast integer arithmetic operations instead of the slower floating-point operations.29,35
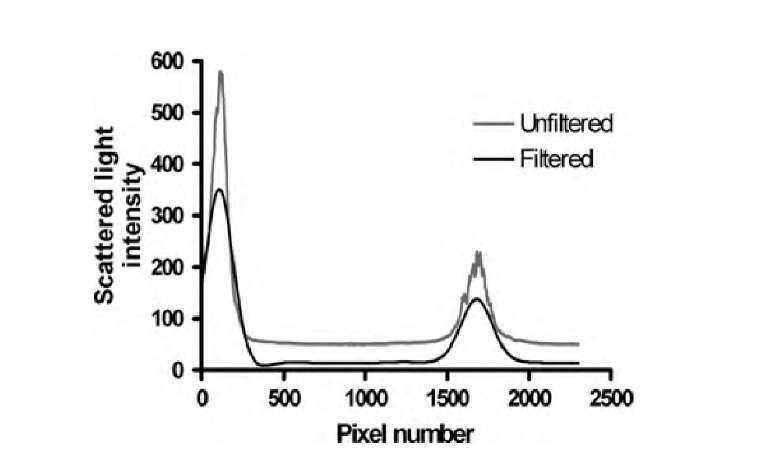
In image processing, Fourier filtering is often an essential step that has, in the overall scheme, little visibility. Optical imaging methods—optical coherence tomography and scattering confocal imaging—were compared to determine their ability to measure the thickness and homogeneity of tissue-engineered sheets.19 In a one-dimensional axial confocal scan, the flask-tissue interface and the tissue-media interface appear as prominent intensity peaks. However, the scan contains noise. A robust method to detect the peaks is the removal of both the noise component and some of the high-frequency detail of the scan itself with a strong Butterworth lowpass filter [Equation (3.18)]. In a scan of approximately 3000 data points, a second-order Butterworth filter with w0 = 10 pixels-1 was used, followed by baseline removal. A sample scan before and after filtering can be seen in Figure 3.16. The same filter could be implemented with a convolution operation, but strong blurring requires a large convolution kernel, and Fourier-domain filtering is more efficient in this case. After filtering, robust peak detection can easily be implemented by finding any pixels whose n neighbors on both sides have a lower intensity.
Image restoration, that is, the application of a filter that reverses a known or partially known image degradation process, almost always calls for filtering in the frequency domain. Most predominantly, the Wiener filter is used. Out of a very large body of literature, three typical examples of Wiener filter application should be considered. Araki and Nashimoto used near-infrared light and a CCD camera to obtain projections from a human forearm.1 Tissue is highly scattering; a point source such as a laser illuminating soft tissue creates a circular area where scattered light reemerges at the surface and the light intensity in this area has a Gaussian profile.
FIGURE 3.16 Noise and detail removal with a Butterworth lowpass. The filtered signal allows more accurate determination of the intensity peaks.
This Gaussian profile can be interpreted as the point-spread function, and Araki and Nashimoto corrected the image degradation by Wiener filtering. A second application is Wiener-filter-based denoising. Special radiochromic film (EBT film) exists which shows an almost linear increase in optical density with radiation exposure. For a computerized analysis of radiation exposure, EBT film is frequently digitized with a scanner. Ferreira et al. examined the influence of various scan parameters and image enhancement steps on the dose reported.10 One step was the application of a Wiener filter for noise reduction, and the finding of this study was that the Wiener filter did not significantly change the calibration curve but reduced calibration uncertainty. The third example involves high-magnetic-strength MR scanners. In strong magnetic fields of 3 T and more, inhomogeneities of the radio-frequency field cause image nonuniformities. Hadjidemetriou et a.l13 developed a spatially adaptive Wiener filter that restored the local cooccurrence statistics of the MR image. In this case, the highpass characteristic of the Wiener filter was used to eliminate low-frequency inhomogeneities. A less typical application of a Wiener filter was presented by Thurman and Fienup.31 It was mentioned that the digitization process limits the frequency components to one-half of the sampling rate (or sampling distance). If the signal contains higher-frequency components, these get mirrored into the low-frequency part of the spectrum and therefore distort the spectrum, a process called aliasing. Thurman and Fienup present the mathematical framework to eliminate the spectral component introduced by aliasing through use of a Wiener filter. Finally, Galatsanos et al. propose an algorithm to optimize a Wiener filter if the point-spread function of the degrading imaging system is known only partially,12 and Bonmassar et al. present a Wiener filter-based method to eliminate motion blur.2
The fast Hartley transform, although not as mainstream as the fast Fourier transform, has been used in medical imaging as well. Its main use is as a real-valued substitute for the complex-valued Fourier transform. For example, Paik and Fox used the fast Hartley transform as a direct substitute for the Fourier transform to study spectra of liver ultrasound images.22 A more general review paper by Oberholzer et al. features the Hartley transform as the method of choice for frequency-domain filtering.21 Villasenor shows that the discrete cosine transform, used universally in image compression, may not be the optimum choice in special cases.32 These special cases include magnetic resonance imaging and positron emission tomography, which are characterized by a circular region of high frequencies where the transform coefficients are very close to zero. Instead of performing a tiled discrete cosine transform and setting high-frequency coefficients to zero (quantization; see Section 12.3), Villasenor proposes the global application of the FFT or FHT and global quantization by exploiting the fact that most high-frequency coefficients are close to zero, thus minimizing quality loss and local discontinuities. These low-valued high-frequency coefficients may also be the reason why Shyam Sunder et al. found image compression with the DHT superior in terms of image quality to DCT-based image compression in brain MR images with high bit depths,30 while the DCT remained superior in other cases, such as angiography images.
The Fourier transform is not only useful for filtering. The coefficients of the Fourier transform can provide quantitative information about images, both in one and multiple dimensions, as will be shown in two examples. In one example, the micromotion of the cell membrane was examined using the light-scattering properties of the cell membrane of cultured cells.14 By applying a refinement over a method described earlier,20 the intensity fluctuations over time of light scattered from a low-incident-angle laser beam were subjected to the Fourier transform and its frequency components were analyzed. These fluctuations exhibit a relatively low dominant frequency of 0.14 Hz, but both peak frequency and overall amplitude are lowered significantly when the cells are treated with paraformaldehyde, a toxin that crosslinks the proteins in the membrane and therefore makes the membrane more rigid. In the second example, spectral properties were found to be related to the perception of images.9 Observer ratings of aesthetic appeal and discomfort of artistic images were compared to the frequency-domain spectra of the image’s luminance. Images often show a strong decay of the amplitude of the frequency components at higher frequencies. Images perceived as "uncomfortable" have unnaturally strong spectral components at spatial frequencies to which the visual system is most sensitive, a fact that the artists apparently exploited.
The Fourier transform is a relevant image processing operation in several topics in this topic. In Section 5.2, some adaptive frequency-domain filtering techniques are explained in detail. In Section 10.4, frequency-domain methods to determine fractal or self-similar properties in images are explored, and frequency-domain texture classification (Section 8.3) and shape classification methods (Section 9.5) are presented. Finally, in Section 12.3, the discrete cosine transform is introduced as a fundamental operation in image compression.


