Generation Approach Impact on Generated Policies
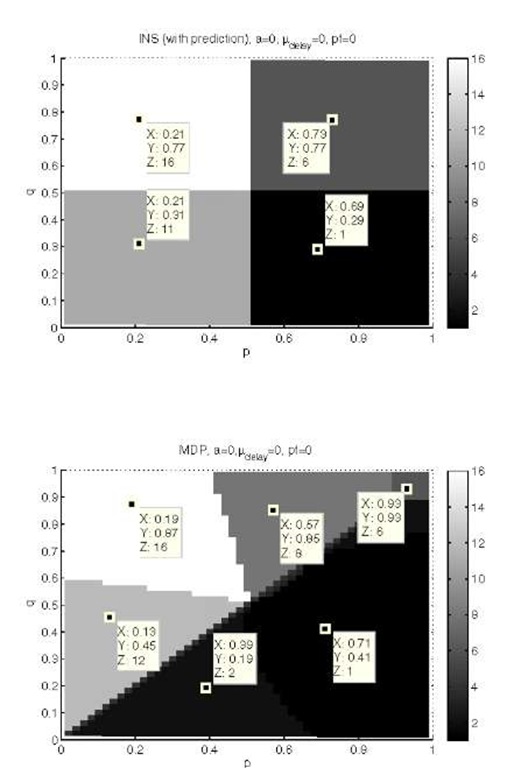
To understand the differences between the INS and the MDP generation approaches, we analyse which policies they generate under equal conditions. We use the full parameter spectrum of the environment states, defined by p and q in P (cf. Table 1), since it represents the scope of environment parameters of the example that characterize external, uncontrollable network state behavior. These properties are relevant to investigate as they cannot be tuned for better performance. We use a forward prediction step in the INS approach for the comparison, to be able to use p and q in both approaches. Figure 5 shows the generated policies (z-values) over the full spectrum of p and q for both approaches in the case of ideal migration (D = 0,pf = 0). There exist many regions in the parameter space where the policies are not equal.
For the INS (Figure 5, top), the regions are divided into four quadrants at p = 0.5 and q = 0.5. At the upper left (z=16) and lower right (z=1) quadrants, the policies specify to go and stay in D2 or D1 configurations, respectively, indifferent of the system state. To the lower left (z=11), the policy specifies to choose D1 configuration when in congested network state and D2 when in normal network state. The upper right region (z=6) chooses opposite to the lower left.
For the MDP (Figure 5, lower), the regions are separated by the line p = q. Below this line (p > q), the policy specifies to either to change to D1 always (z=1) or in some cases (z=2) to stay in D2 when in congested network state. Above the line (p < q), several different policies are used that will eventually all change to D2 always (z=8,12,16). In the small region (p > 0.9 and q > 0.9) the MDP behaves similar to the INS by choosing D1 in normal network state and D2 in congested network state (z=6).
The differences in the overall policy distributions are due to the way the two policy generation methods optimize their policies. Even though they both optimize for utility, the INS method only regards 1 future decision, whereas the MDP regards 1000. The different distributions show that it has an impact on the policy whether the future decisions are considered.
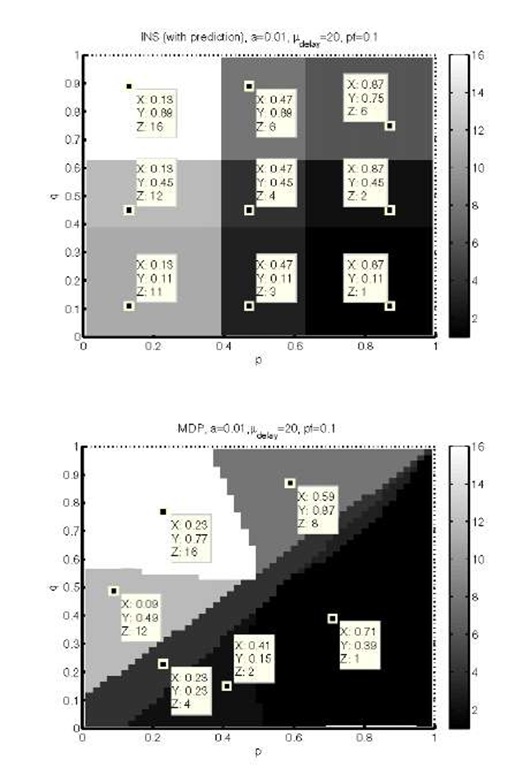
Figure 6 shows the policies over the full spectrum of p and q for both approaches in the case of non-ideal migration (D = 20,pf = 0.1). The INS policy distribution clearly changes compared to ideal migration. Instead of 4 regions, 9 regions exist, with the original 4 regions still existing though smaller. In a square-formed region in the center, a new policy is seen (z=4), which is the policy that chooses to stay in the current/initial configuration at all times. The additional 4 new policies between each pair of former quadrants are combinations of the original policy pairs. For example, this means that the policy in the middle lowest square (z=3) combines choosing D1 always (the policy to the right, z=1) and choosing D2 in normal network state (the policy to the left, z=11) in the way that it chooses D1 always except if in D2 and normal network state. The MDP policy distribution is very similar to the non-ideal case, except that the small region upper right is gone and there is a new region around p = q, that contains the same policy as the center square (z=4) in the INS figure, namely not to change configuration when network state changes. The no-change policy (z=6) is found in both INS and MDP distributions when the migration is non-ideal which can be explained by the added probability of failure and long migration delay, which decreases the expected average utility that both methods optimize for. In the border-line regions of both approaches, a higher penalty means a higher probability of decreased utility when migrating, and as a consequence, migration is not chosen in the specific cases.
Fig. 5. Policies generated by INS (top) and MDP (bottom) approaches for different parameter settings, ideal migration
Fig. 6. Policies generated by INS (top) and MDP (bottom) approaches for different parameter settings, non-ideal migration
Generation Approach Impact on Application Quality
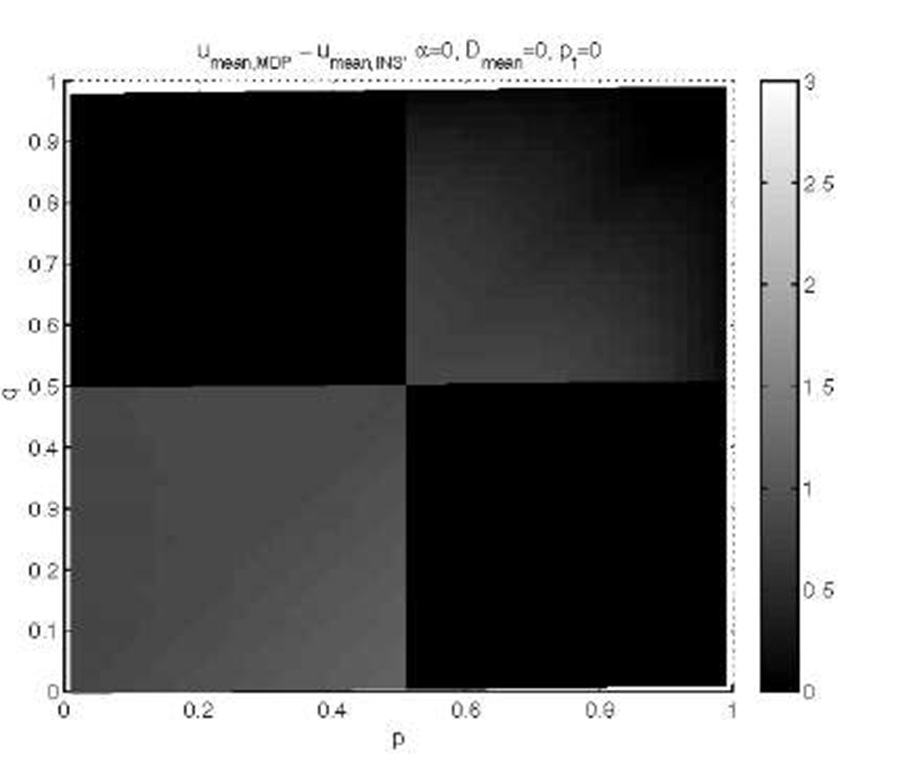
To understand the impact on the quality of the different policies, we simulated runs of the decision framework using all policies from both approaches in the entire parameter space, for ideal and non-ideal migration respectively. For each approach we calculated the average utility in each simulation with a specific policy, and calculated means over the repetitions. We repeated simulations to obtain significant differences within 95% confidence intervals. In these simulations we used an ideal state estimator. The differences in mean average quality between the approaches at each point (p, q) are shown in Figure 7 for ideal migration and in Figure 8 for non-ideal migration. Black means no difference (because INS and MDP policies are the same) and the brighter the tone, the larger the difference.
Fig. 7. Average utility difference between INS and MDP approaches for different settings of p and q, with ideal migration
Fig. 8. Average utility difference between INS and MDP approaches for different settings of p and q, with non-ideal migration
The range of average utility varies between 1.6 and 4 for the different points (p, q), so a difference of 3 is relatively large.
In the ideal migration case of Figure 7, we see that in two regions (p < 0.5 and q < 0.5) and (p > 0.5 and q > 0.5) the policies of the MDP approach generate higher average utility values than the policies of the INS approach. In the non-ideal migration case, as shown in Figure 8, differences are detected in the lower left and upper right regions. The corner regions are similar to those in ideal migration, but smaller in area and with larger average utility differences. The evaluation results from the example show that in some cases the use of the MDP gives an advantage. The advantage depends on the penalty of the migration, which is a key property of the MDP approach.
State Estimation Accuracy
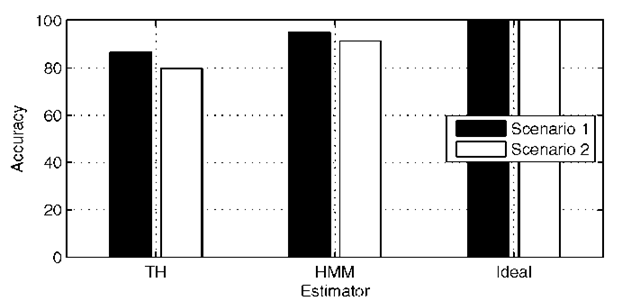
The above performance evaluation is performed with ideal state estimation. In the following we describe properties of a non-ideal state estimator and the impact on the performance of the generation approach. Instead of using the entire (p,q)-spectrum, we limit the analysis to two scenarios. In scenario 1, we simulate a network that has a low rate of state changes. In scenario 2, we simulate a fast-changing network with a high rate of changes. The differences between the two networks are expressed in the state transition probabilities. In scenario 1, the probability of changing state is very low (0.1-0.5 changes per second on average), which is seen in Table 2. In scenario 2, it is opposite, such that the probability of changing state is very high (9.5-10 changes per second on average), as seen in Table 3. Since the instantaneous approach assumes a slowly changing environment, it is expected to perform well with in the first scenario and poorly in the second. As the MDP generates the optimal policies, it should perform best in both scenarios. We measured the estimator accuracy as the ratio between the number of correctly estimated states and the number of true states. The results are shown in Figure 9.
Table 2. Transition probabilities ![]() (scenario 1)
(scenario 1)
 |
N |
C |
|
N |
p=0.99 |
0.01 |
|
C |
0.05 |
q=0.95 |
Table 3. Transition probabilities ![]() (scenario 2)
(scenario 2)
 |
N |
C |
|
N |
p=0.01 |
0.99 |
|
C |
0.95 |
q=0.05 |
Fig. 9. Accuracy of the estimators, including the theoretical ideal estimator
From the figure we see that overall the HMM has a better accuracy, and that the increased state change rate in scenario 2 impacts the estimation accuracy of both approaches. The ideal state estimator is shown for reference.
Inaccurate State Estimation Impact on Performance
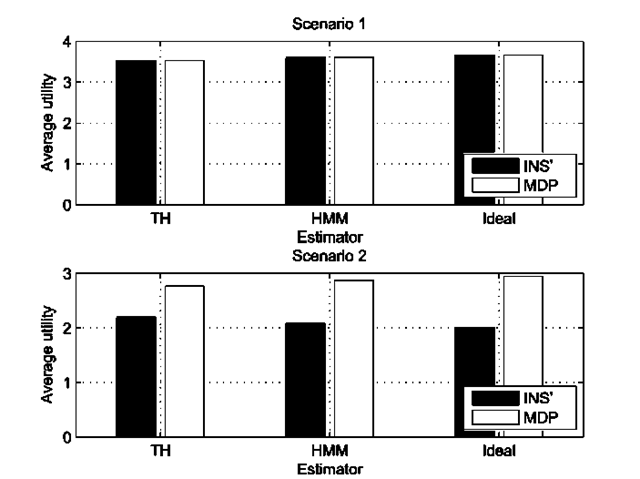
We evaluate the performance of the combined state estimation methods and generation approaches by calculating the average quality achieved during a simulation run.We use both scenarios for evaluation to illustrate the robustness of the MDP approach. To get a clear understanding of the impact of state estimation inaccuracy, we used the INS approach without state prediction, INS’, in this evaluation. The policy of the INS’ approach is the same in both scenarios as it only depends on the reward distribution and not the transition probabilities. The policy is defined as
The interpretation of the policy is that if normal network state is observed (column 1) then c’ = D1 is decided. If high packet loss is observed (column 2) then c’ = D2 is decided. The optimal policy generated by the MDP in scenario 1 is equal to the INS’-policy. For scenario 2, the MDP generates a policy opposite to the previously used
Based on the sequences of chosen configurations and true states, we calculated the average utility achieved during the simulation runs. The mean average utilities in both scenarios are shown in Figure 10, where also results from using the theoretical ideal estimator are shown.
Fig. 10. Average utility comparison between the three estimation methods and the two policy generation methods in both network scenarios
The differences are significant in all cases within a 95% confidence interval. In scenario 1, only the state estimation method makes a difference since the policies are equal. In scenario 2, the policies are opposite. Since the MDP policy is optimal, the average quality increases with increasing estimation accuracy. However, the instantaneous policy is opposite the optimal and always makes the worst decision. This explains the decrease in average quality with the increasing estimator accuracy. The fact, that the INS’ approach produces the lowest average utility with the ideal estimator in scenario 2 is due to the behavior of the INS policy. Since they are opposite of the optimal policy, INS’ performance benefits from any inaccuracy in the state estimation.
Conclusion and Future Work
We have proposed a decision framework for service migration which uses a model-based policy generation approach based on a Markov Decision Process (MDP). The MDP approach generates an optimal decision policy and considers the penalty of performing the migration (failure probability and delay) when implemented in the migratory system. One key property of the MDP approach is the ability to consider the effect of future decisions into the current choice. With the MDP approach, policies are enforced based on the state of the environment. As the state is not always observable, we introduce a hidden Markov model (HMM) for estimating the environment state based on observable parameters. An example system was simulated to evaluate the MDP approach by comparing to a simpler instantaneous approach. The average user experience quality of the generation approach was compared to a simple instantaneous approach that does not consider future decisions. The comparison used a model of a slowly changing network and showed that the introduction of the HMM alone gives benefits, as the achieved average quality was slightly higher for the MDP approach than the instantaneous approach. When the network model was changed to include more rapid changes, the MDP approach produced the highest quality and followed the dynamics of the environment more precisely. With our results we are able to quantify the gain in performance of considering future decisions.
Future work should extend the capabilities of the framework to enable online generation of policies to support changing environment models, and ultimately learn environment parameters online to change policies during run-time.

![tmp4A2-277_thumb[2] tmp4A2-277_thumb[2]](http://what-when-how.com/wp-content/uploads/2011/07/tmp4A2277_thumb2_thumb.png)
![tmp4A2-278_thumb[2] tmp4A2-278_thumb[2]](http://what-when-how.com/wp-content/uploads/2011/07/tmp4A2278_thumb2_thumb.png)
