Geoscience Reference
In-Depth Information
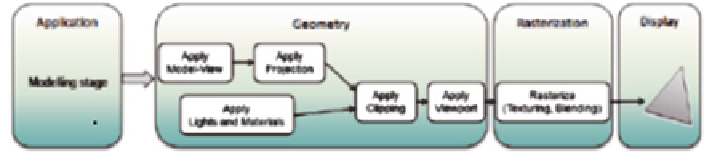
Fig. 4
Rendering pipeline after (Woo et al.
2001
)
4.2 OpenGL ES Rendering
The cross-platform and cross-language graphics Application Programmers
Interface (API) OpenGL (Open Graphics Library) is a software interface to graph-
ics hardware (McReynolds and Blythe
2005
). OpenGL has several specifica-
tions for various purposes. Of relevance here is OpenGL ES, which is commonly
implemented for mobile devices. Key features were removed from OpenGL for
this implementation (Anyuru
2012
)—in particular OpenGL ES only allows trian-
gle-based surface primitives and excludes quad, quadstrip or polygon primitives.
Triangles make hardware algorithms simpler and faster, as they are always convex
and planar (Cozzi and Ring
2011
).
Figure
4
[after (Zechner and Green
2011
)] shows the path of a dataset through
the rendering process in OpenGL ES. For standard rendering, the
modelling
soft-
ware first generates a triangle mesh, which defines the shapes of the objects, and
their attributes, colours, textures. Using the hybrid approach here, this is done on
the server. Once transmitted, the client-side software the collates the triangles into
an OpenGL readable structure (arrays containing the triangle points and index
arrays describing how these are used to describe the objects to be rendered). The
data structure enables OpenGL to reuse the same vertex for several triangles,
reducing memory requirements on the device.
Once the data is correctly structured into arrays, a process of translation and
scaling is required to ensure the 3D City Model is visible. The dataset is also
scaled to ensure that the ratio between the X and Y extents matches the width:
height ratio of the device (i.e. that the resulting data is not distorted). Data is then
projected into a 2D coordinate system for display on screen, with an orthographic
projection avoiding foreshortening (Smithwick and Verma
2012
) by disregarding
the effect of vanishing points and applying a one to one correspondence between
the real world units and the pixel positions on screen. This method is widely used
for engineering applications (Whitrow
2008
).
Following projection, a “clipping” process is used to remove any objects that
will not be visible to the user. For example, objects too close to the user obscure
the view, and objects too far away will not be shown in enough detail to be use-
ful. The penultimate step in rendering is transforming the resulting 2D data once
again, to move from scaled real world coordinates into the screen coordinate sys-
tem. The data is then ready for the final stage in the process- rasterization, which
converts the data into pixels on screen (Zechner and Green
2011
).