Geoscience Reference
In-Depth Information
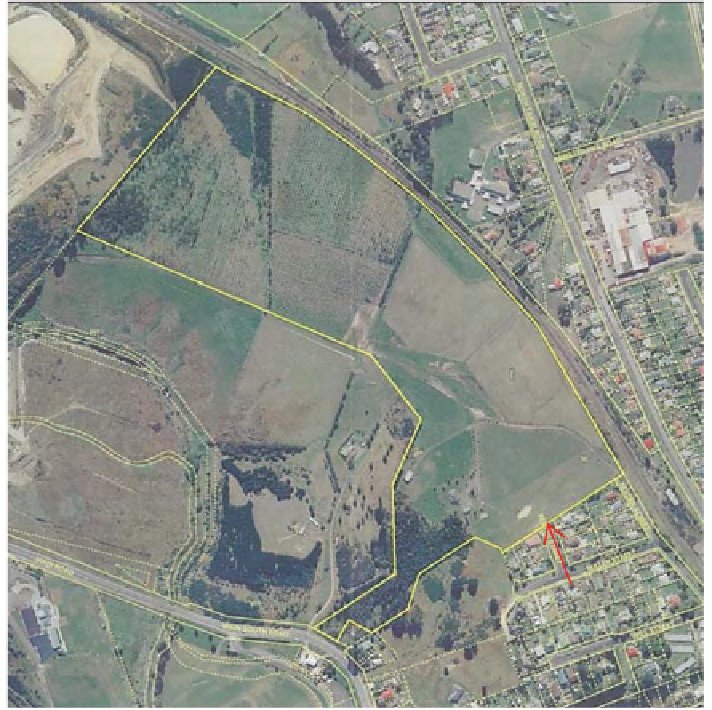
N
Stage 1
Fig. 2
The study site, Grand Vista. The
yellow
boundary highlights the whole re-designated
zone. The
red
line
indicates the target area for the 3D design environments
the main dataset needed. Finally, a subdivision parcel boundary plan for the site
was designed and digitized in CAD.
For GIS and VE, all data (including CAD) were subsequently imported into
Esri ArcGIS 10. A Triangulated Irregular Network (TIN) was created with the
DEM and mass points from neighbouring 2 m contour data as input. The resultant
TIN filled a 768 m
×
768 m area sufficient to enclose the development site. This
underpins the 3D GIS model to be tested.
For the VE only, vector CAD data was converted to 3D GIS data which in turn
was used to “emboss” a copy of the TIN so that there was an imprint of road edges
and the site boundary apparent on the TIN surface. This was achieved by giving
each feature a constant z-value that could be added to the level of the underlying
terrain. The augmented TIN was converted to raster GRID format.