Geoscience Reference
In-Depth Information
100°E
110°E
120°E
130°E
40°N
NORTH
KOREA
40°N
Beijing
SOUTH
KOREA
30°N
30°N
CHINA
TAIWAN
Hong Kong
20°N
20°N
Land above 1000m
100°E
110°E
120°E
130°E
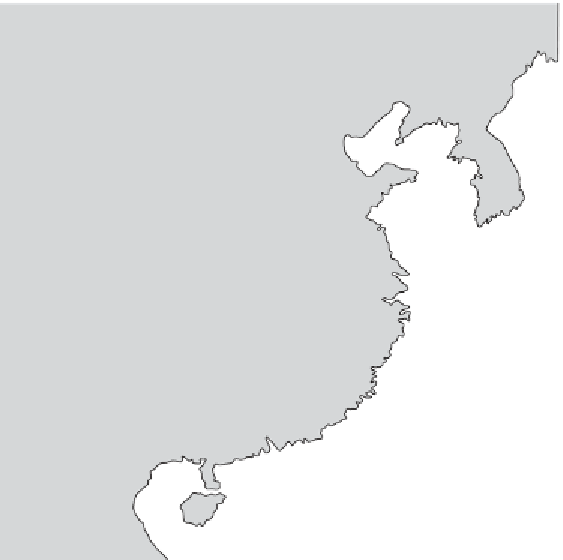
Figure 23.3. Map showing the correlation between the annual rainfall index for China
and the Southern Oscillation Index for June, July and August for the 1870-1979
period. Correlation coefficients greater than 0.25 (cross-hatched areas) are signific-
ant at the 1% level, after allowing for the reduction in degrees of freedom due to
persistence, although this effect is quite small. (Modified from Whetton et al.,
1990
,
fig. 3.)
Ni no years, and floods occurred during La Ni na years (
Figure 23.4
). In Java, drier-
than-average years result in slower-than-average growth among teak trees (
Tectona
grandis
), so that the long tree ring record for the 1852-1929 period collated by Berlage
(
1931
), published by de Boer (
1951
) and reanalysed by Murphy and Whetton (
1989
)
can be compared with the SOI.
Figure 23.5
shows that years characterised by narrow
tree rings in Java were also years of negative SOI. Tapper (
2002
) has shown that
during the 1877-1998 period, ENSO events coincided with both droughts and fires
in Indonesia (
Table 23.3
). There is also a close correlation between years of narrow
tree rings in Java and years when the Nile gauge at Roda in northern Egypt showed
significantly below-average flows in the Nile at Cairo (
Figure 23.6
), indicating failed
summer rains in the Ethiopian headwaters of the Blue Nile. The intervals 1737-
1800 and 1825-1903 were chosen because they reflect little or no interference from
dams and other river regulation structures with flood gauge readings.
Figure 23.7
summarises much of the preceding discussion into a single diagram
that shows statistically significant correlations, or 'teleconnections', between rainfall