Geoscience Reference
In-Depth Information
(a
)
2.0
1.5
1.0
0.5
0
-0.5
-1.0
-1.5
1900
1920
1940
1960
1980
2000
(b
)
1015
Tahiti SLP
Darwin SLP
1014
1013
1012
1011
1010
1009
1880
1900
1920
1940
1960
1980
2000
(c)
2.0
1.0
0
-1.0
-2.0
1880
1900
1920
1940
1960
1980
2000
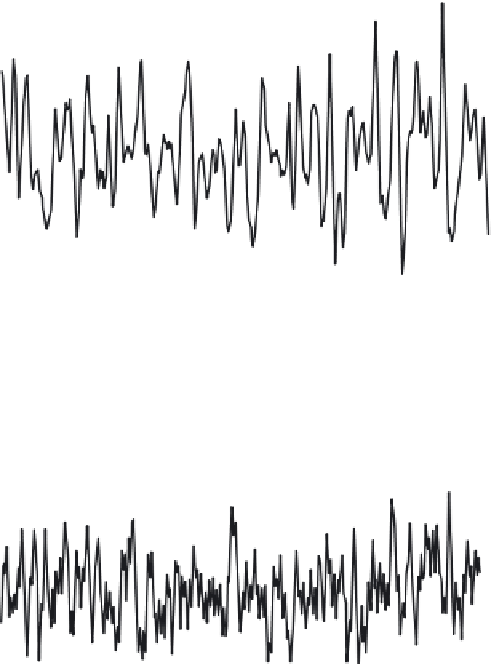
Figure 3.6 (a) Niño 3.4 sea surface temperature anomalies
(difference from the 1971-2000 mean), smoothed; (b) Sea level
pressure (SLP) at Darwin (black) and Tahiti (gray), 11-month running
mean; (c) Southern Oscillation Index (SOI), 11-month running mean.
From NOAA's Climate Diagnostic Center.