Geoscience Reference
In-Depth Information
5
4
3
2
1
90°N
60°N
30°N
Equator
30°S
60°S
90°S
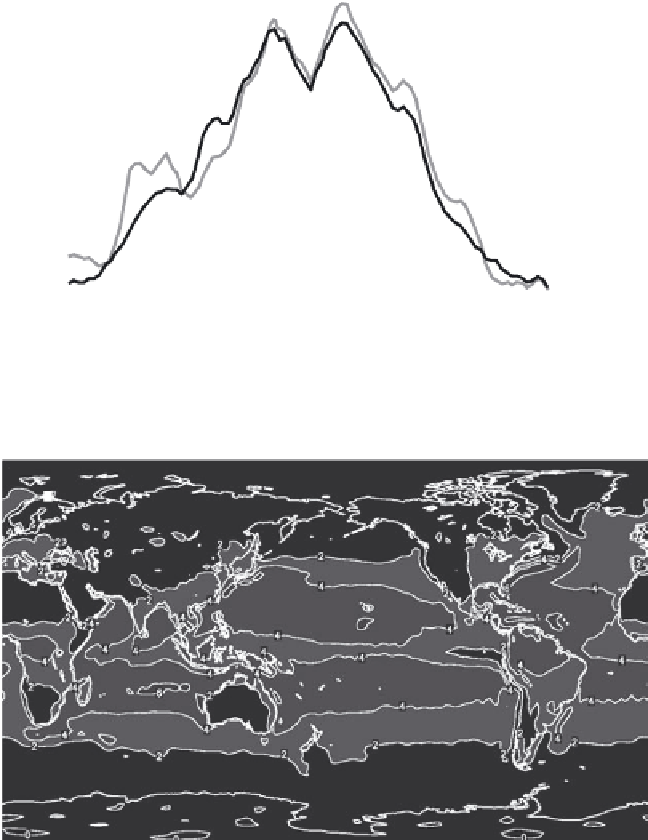
Figure 2.28 Zonally averaged evaporation climatology in mm/day
for the annual mean (black line), December-January-February mean
(dotted line), and June-July-August mean (gray line).
2
2
60°N
2
2
2
2
4
2
2
2
30°N
4
6
4
2
2
4
2
4
4
4
2
4
4
Equator
2
4
4
4
4
4
4
4
4
4
4
2
4
4
6
2
4
4
30°S
4
2
4
4
2
2
2
2
2
2
60°S
0
0
0
0°
30°E
60°E
90°E 120°E 150°E 180° 150°W 120°W 90°W 60°W 30°W 0°
Figure 2.29 Annual mean evaporation climatology as represented in the NCEP/NCAR
reanalysis. Contour intervals are 2 mm/day.
air. Direct measurements of specific humidity are not available for construct-
ing a global climatology, so reanalysis is used to provide an estimate of how
water vapor is distributed in the atmosphere. The zonal mean specific humidity
distribution (
Figure 2.30)
reveals the following:
• Most of the water vapor in the atmosphere is located close to the surface,
within the lowest 1 or 2 km of the troposphere.
• Speciic humidity decreases approximately linearly with pressure up through
the troposphere (i.e., to first order, the spacing between the contour lines is
constant). Because pressure falls off exponentially with height, this implies