Geoscience Reference
In-Depth Information
(a) DJF
90°N
60°N
11600
11600
30°N
12400
12400
Equator
12400
12400
12400
30°S
11600
11600
60°S
90°S
0°
30°E
60°E
90°E
120°E
150°E
180°
150°W 120°W
90°W
60°W
30°W
0°
20
(b) JJA
90°N
60°N
12400
12400
30°N
Equator
12400
12400
12400
30°S
11600
11600
60°S
10800
10800
90°S
0°
30°E
60°E
90°E
120°E
150°E
180°
150°W 120°W
90°W
60°W
30°W
0°
20
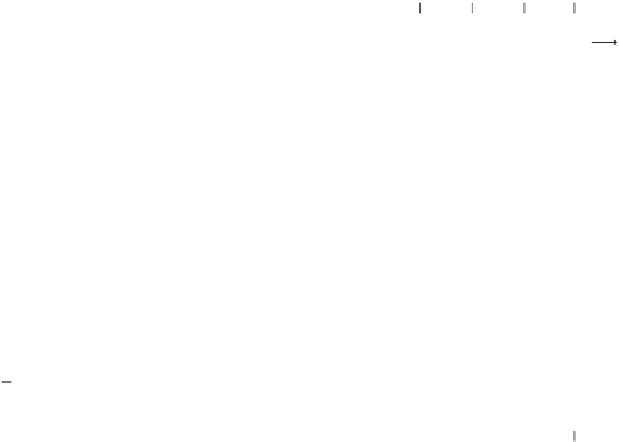
Figure 2.14 Upper-troposphere (200 hPa) winds and geopotential height contours
for (a) December-January-February (DJF) and (b) June-July-August (JJA). The
vector scale indicated in the lower right is in m/s.
lines pinch together, that is, where meridional geopotential height gradients are
larger. This happens most prominently in DJF in the storm tracks off the east
coasts of Asia and North America.
2.2 THE OCEAN
Observations of the oceans are less complete than observations of the atmo-
sphere. Oceanographers traditionally relied, in part, on “ships of opportunity”
for direct measurements of surface water temperatures and currents. These