Geoscience Reference
In-Depth Information
(
a)
DJF
90°N
60°N
800
800
30°N
800
800
800
800
800
Equator
800
800
800
30°S
600
600
60°S
600
600
90°S
0°
30°E
60°E
90°E
120°E
150°E
180°
150°W 120°W
90°W
60°W
30°W
0°
15
(b) JJA
90°N
60°N
800
800
800
30°N
800
Equator
800
800
800
30°S
800
800
600
600
600
60°S
600
600
90°S
0°
30°E
60°E
90°E
120°E
150°E
180°
150°W 120°W
90°W
60°W
30°W
0°
15
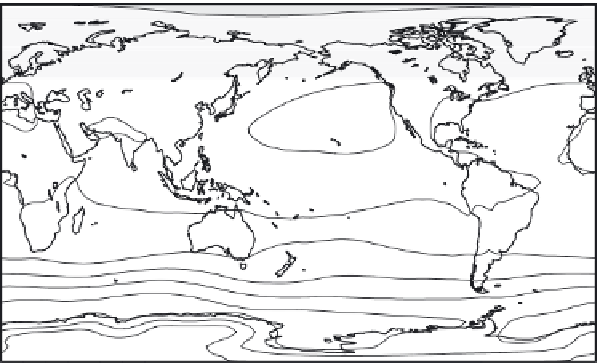
Figure 2.13 Lower-troposphere (900 hPa) winds and geopotential height
contours for (a) December-January-February (DJF) and (b) June-July-August
(JJA). The vector scales indicated in the lower right are in m/s.
• The low around regions of high geopotential heights is clockwise in the
Northern Hemisphere and counterclockwise in the Southern Hemisphere,
and this is known as
anticyclonic
flow. The reasons for these flow patterns
will become clear when we study the forces that produce them in
chapter 6.
Winds in the upper troposphere, represented by the 200 hPa level in
Figure
2.14,
are considerably more zonally uniform than those in the lower tropo-
sphere, consistent with the geopotential height structure. Especially easy to see
in this figure is that zonal wind speeds are greater where geopotential height