Geoscience Reference
In-Depth Information
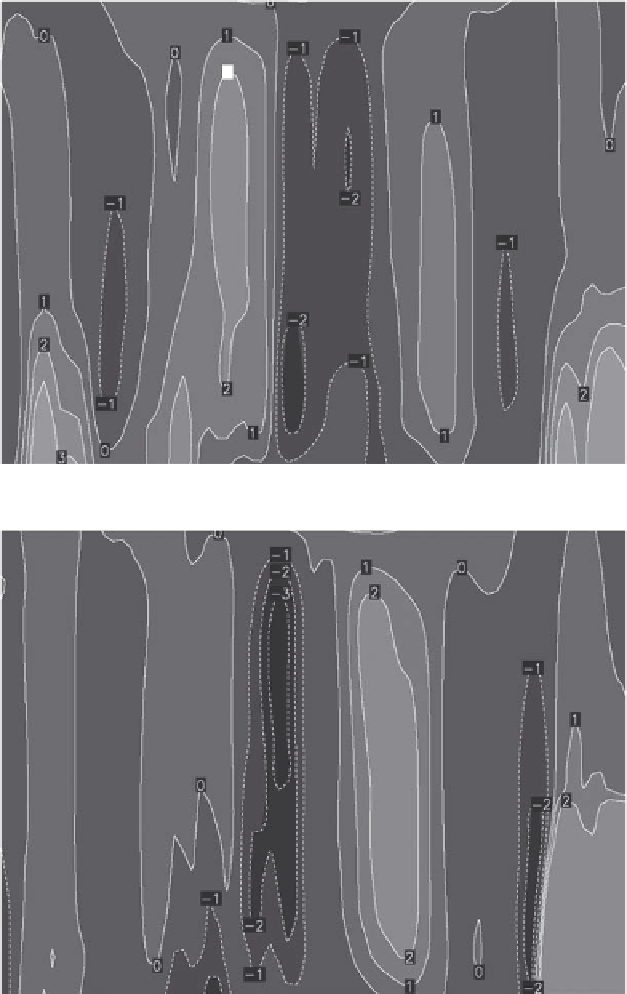
(a
) DJF
100
0
0
1
-1
-1
200
0
2
300
1
0
400
-2
-1
500
-1
600
1
700
-2
2
800
-1
2
2
-1
900
1
1
D
C
D
0
3
1000
90°N
60°N
30°N
Equator
30°S
60°S
90°S
100
(b
) JJA
0
-1
1
0
-2
200
2
-3
300
-1
400
1
500
0
600
2
-2
700
800
-1
-2
900
2
0
0
-1
C
D
1
1000
-2
90°N
60°N
30°N
Equator
30°S
60°S
90°S
Figure 2.12 Zonal mean vertical
p
-velocity (multiplied by 100) for (a) December-
January-February (DJF) and (b) June-July-August (JJA). Contour interval is 0.01
Pa/s and negative values denote upward motion. Arrows indicate wind direction.