Geoscience Reference
In-Depth Information
90°N
270
60°N
270
270
285
285
285
285
30°N
Equator
285
285
30°S
285
285
270
60°S
270
270
255
240
255
255
240
90°S
0°
30°E
60°E
90°E
120°E
150°E
180°
150°W
120°W
90°W
60°W 30°W
0°
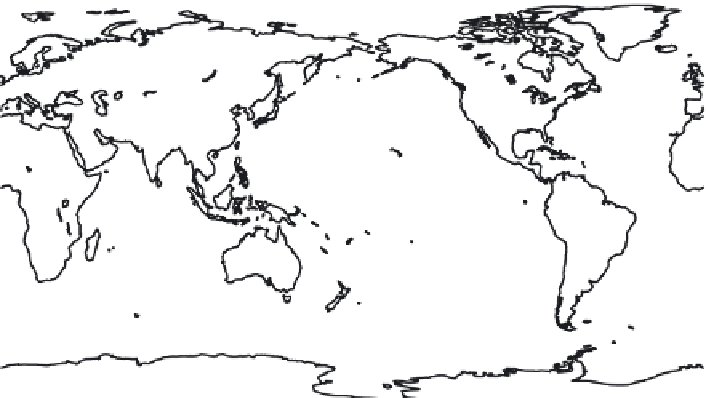
Figure 2.6 Annually averaged air temperature at 900 hPa. The contour interval is 5 K.
Figure 2.6
portrays the annual mean air temperature climatology at 900
hPa. Note the following features:
• Annual mean air temperatures over land tend to be warmer than over the
oceans at the same latitude. (Note how the isotherms curve poleward over
the continents in both hemispheres.)
• The lowest annual mean surface air temperatures on the planet are located
over Antarctica, where they are about 60 K colder than the warmest
temperatures over northern Africa.
• Surface air temperatures on the eastern sides of the Atlantic and Paciic
Ocean basins are cooler than over the western sides of the basins in both
hemispheres. (Note how the isotherms dip equatorward over the eastern
sides of the Pacific and Atlantic Ocean basins.)
•
Continentality
, defined as the effects of land/sea distributions on climate
variables, is in evidence in the temperature field, as it was for the
geopotential height distributions shown above.
• The
thermal equator
marks the latitude of maximum temperature. Note that
it is not necessarily located on the geographical equator and tends to favor
the Northern Hemisphere.
• Meridional temperature gradients, indicated by the density of the isotherms
in the north/south direction, are greater in middle and high latitudes than in
the tropics.
Seasonal air temperatures at 900 hPa and their differences are displayed in
Figure 2.7.
•
Seasonality,
defined here as differences in climate variables between DJF and
JJA, is larger over the continents than over the oceans, and greater at high
latitudes than at low latitudes.