Geoscience Reference
In-Depth Information
30
2
22
25
2
23
2
24
20
2
25
2
26
15
2
27
10
2
28
5
2
29
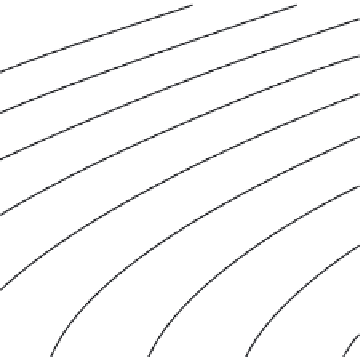
Figure 8.7 A
T-S
plot for ranges
in temperature and salinity (psu)
relevant to the oceans, at surface
pressure.
0
33
34
35
36
37
Salinity (psu)
and 36.5 psu. According to the
T-S
plot shown in
Figure 8.7,
which is similar
to
Figure 5.1
but restricted to salinities typical of the ocean, the top layer of
water is less dense (
σ = ). This is a stable con-
figuration. If some perturbation brings a parcel of water from the upper layer
into the lower layer, the parcel will float back to the upper layer, and the initial
state will be reestablished.
Now, imagine that the ice thickens, and the water in the layer beneath the
ice becomes more saline due to brine exclusion. Suppose that the salinity of
the top water layer increases to 34.8 psu. This water is still fresher than that in
the lower layer but its density has increased to
) than the lower layer (
σ =
27.3
28
σ = , the same as that of the
lower layer. Having the same density, the two layers are now free to mix. As-
suming that the masses of the two layers are equal, the temperature and salinity
of the mixed water will be the average of the two layers, 5°C and 35.25 psu,
respectively. According to the
T-S
plot in
Figure 8.7,
the density of the mixture
is
28
σ = , which is greater than the density of the unmixed layers. The newly
mixed water will sink.
28 2
.
8.4 REFERENCE
Garcia, H. E., R. A. Locarnini, T. P. Boyer, and J. J. Antonov, 2006. World Ocean Atlas
2005. S. Levitus, ed. NOAA Atlas NEDIS 63, U. S. Government Printing Office,
Washington, DC.
8.5 EXERCISES
8.1. Suppose that a wind from the west produces a stress on the ocean at 45ºN
latitude. In what direction is the Ekman transport? If the stress is 0.1 Pa, what
is the magnitude of the Ekman volume transport across a 1000 km line?
Express your answer in cubic meters per second (m
3
/s) and in sverdrups (Sv).