Geoscience Reference
In-Depth Information
-60
60°N
-60
30
-60
30°N
-120
30
30
30
60
30
30
60
30
30
Equator
120
60
30
30
30
60
30°S
30
60
30
30
30
60°S
30
0°
30°E
60°E
90°E
120°E 150°E 180° 150°W 120°W 90°W 60°W 30°W 0°
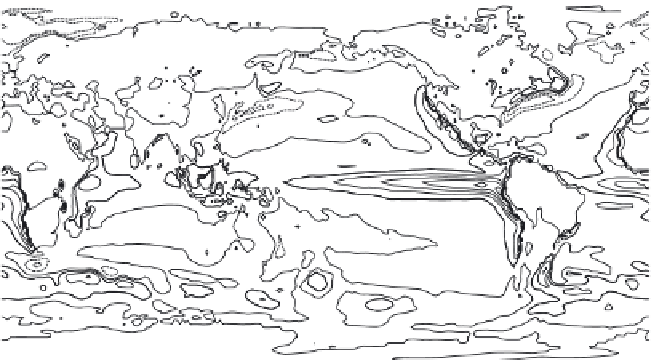
Figure 5.13 Contribution of horizontal and vertical heat fluxes within the surface to
the local heat balance. Contour interval is 30 W/m
2
. Dashed contours indicate
negative values.
In contrast to the sensible heat flux, the latent heat flux is larger over the
oceans than over land due to the essentially limitless supply of water for evapo-
ration. The latent heat flux is the product of the evaporation rate and the latent
heat of vaporization so the patterns of
Fig. 2.29
are repeated in
Figure 5.12b,
but more detail is displayed in the latter. Maximum latent heat fluxes occur in
the subtropics where the surface is warm, trade winds provide a strong, steady
surface wind at all times of the year, and the overlying air is dry.
term is calculated as a residual using reanalysis values in Eq. 5.29.) When
F
SFC
> 0, ocean currents and/or upwelling are contributing to regional cool-
ing of the surface temperature.
F
SFC
is small over land, since the solid surface
does not conduct much heat horizontally or even vertically. The large positive
values in the tropical east Pacific and Atlantic Oceans indicate that the eastern
boundary currents and upwelling contribute to the lower temperatures of the
cold-tongue regions. Negative values in the vicinity of the western boundary
currents—the Gulf Stream in the western North Atlantic and the Kuroshio in
the western North Pacific—signify the warming role of these currents in middle
and high latitudes.
5.5 ADDITIONAL READING
A contemporary estimate of the global heat balance, including a discussion of
uncertainties, is provided in the article “Earth's Global Energy Budget” by K. E.
Trenberth, J. T. Fasullo, and J. Kiehl in the
Bulletin of the American Meteoro-
logical Society
90:311 (2009).
Fig. 5.4
is based on this estimate.