Geoscience Reference
In-Depth Information
30
M
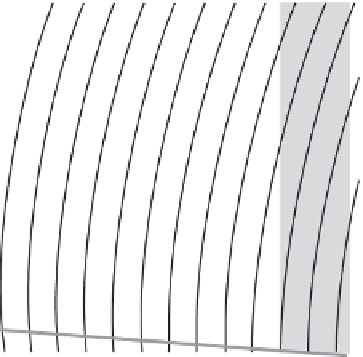
Figure 5.1
T
-
S
plot showing the
dependence of seawater density
on temperature and salinity.
Contours of constant density are
labeled s r
w
1000, where r
w
is the density of seawater (kg/
m
3
). Gray shading indicates
approximate temperature
and salinity ranges of ocean
surface waters. “M” indicates
the location of Mediterranean
waters, and “A” the location of
Arctic waters. The dashed line
indicates the density maxima,
and the gray line denotes the
freezing temperature.
0
25
5
20
1
10
1
15
15
2
20
10
2
25
3
30
5
0
A
0
10
20
30
40
Salinity (psu)
it reaches a temperature of 3.98°C. Further cooling of the water
decreases
its
density. This unusual behavior of water is the reason that ice forms on the
surface of lakes and, more generally, why ice floats. Because lakes freeze from
the top, the habitat for fish and other lacustrine creatures is preserved through
the winter.
Another property of seawater relevant to climate is that its freezing tem-
perature is below 0°C. As shown in
Figure 5.2b,
and by the gray line in
Fig-
ure 5.1
, the freezing point of water with a salinity of 30 psu is −1.8°C and a
5 psu increase in salinity corresponds to a decrease of 0.28°C in the freezing
temperature.
When ocean water begins to freeze and sea ice forms, salt is rejected from
the ice crystal structure, increasing the salinity of the water below the sea ice
and decreasing its freezing temperature. The fresher (lighter) sea ice floating on
(a) Pure water
(b) Freezing temperature
1000.0
0
999.5
-0.5
999.0
-1.0
998.5
-1.5
998.0
-2.0
0
5
10
15
20
0
10
20
30
Temperature (°C)
Salinity (psu)
Figure 5.2 Relationships between (a) temperature and density for freshwater and
(b) salinity and freezing temperature for seawater.