Geoscience Reference
In-Depth Information
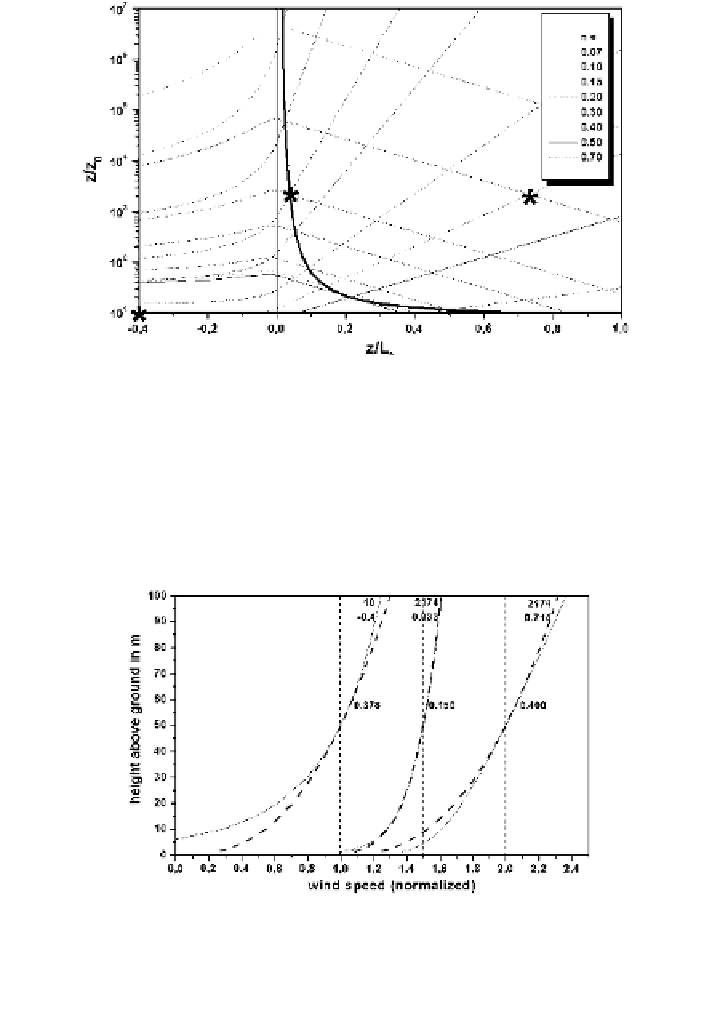
Fig. 3.6 Solution of the Eqs. (
3.33
)-(
3.36
) and (
3.38
) in the phase space spanned by the
roughness parameter z/z
0
and the stratification parameter z/L*. Thin lines from lower left to upper
right (calculated from (
3.33
) and (
3.34
)) indicate for different exponents a (given in the box to the
upper right) when a logarithmic profile and a power law profile have equal slopes, thin lines from
left to lower right (calculated from (
3.35
) and (
3.36
)) indicate for different exponents a when a
logarithmic profile and a power law profile have equal curvatures, the thick line (calculated from
(
3.38
)) runs through the points where the solutions from (
3.34
) and (
3.36
) are equal. The three
asterisks mark the position of the examples shown in Fig.
3.7
Fig. 3.7 Three normalised non-neutral wind profiles extrapolated from the 50 m wind speed for
increasing stability (from left to right, the second number from above gives z/L*). Full lines
logarithmic profiles from (
3.16
) (uppermost number gives z/z
0
), dashed lines power profiles from
(
3.22
) (number in the middle gives the exponent a). The middle curve has been shifted to the right
by 0.5 and the right curve has been shifted to the right by 1.0 for better visibility
neutrally stratified boundary layer, this perfect fit is not possible although the fit
becomes the better the smoother the surface is. The worst fit occurs for unstable
conditions and rough terrain. Due to the fact that the atmosphere is usually stably
Search WWH ::

Custom Search