Geoscience Reference
In-Depth Information
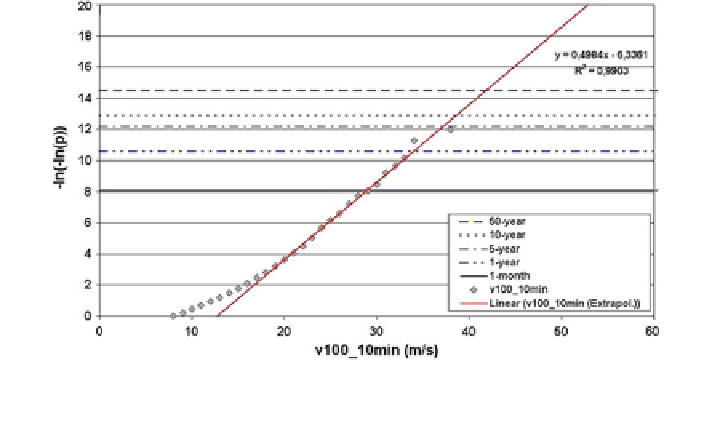
Fig. A.5 Gumbel plot of a time series from 10 min mean wind speeds observed at 100 m at the
FINO 1 mast in the German Bight during the 4 years from September 2003 to August 2007. Wind
data have been lumped into 1 m/s bins
If a time series is much shorter than the interesting return period, then the series
of annual extreme values will be too short for a meaningful analysis. For example,
it does not make sense to pick out four annual extreme values from a four-year
time series and to extrapolate a straight line through this data. But another
possibility exists in this case, which has been demonstrated in Emeis and Türk
(
2009
). Here, the 50 year extreme mean wind speed had been estimated from
4 years of 10 min mean wind data (about 200,000 data points). This procedure has
also been used in Carter (
1993
) and Panchang et al. (
1999
) and is based on the
assumption that the wind speed time series follows a Fisher-Tippett Type 1
distribution.
The probability of a 50 year extreme from such a time series with 10 min
intervals (52,560 data points a year) is given by p = 1-1/(50 9 52,560), giving -
ln(-ln (p)) = 14.78. For hourly values the threshold value would be 12.99.
Figure
A.5
shows the Gumbel plot of a wind speed time series based on 10 min
mean values. It features a nearly perfect straight line for the extreme wind speeds
above 18 m/s (the large majority of values are below 18 m/s and these follow a
Weibull distribution which does not give a straight line in a Gumbel plot). The
equation for this straight line according to (
A.32
)isu
max
= 2.01 (-ln(-
ln(p))) + 12.71 (the inverse of this equation is given in the upper right of Fig.
A.5
).
This can be used to extrapolate to the 50 year extreme value of the 10 min-average
wind
speed
which
turns
out
be
2.01 9 14.78 + 12.71 = 42.42 m/s
in
this
example.
Search WWH ::

Custom Search