Geoscience Reference
In-Depth Information
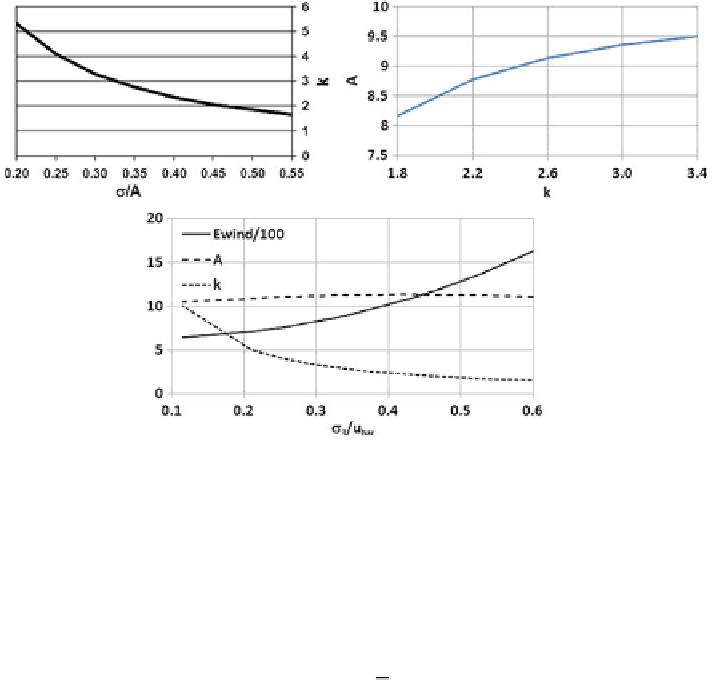
Fig. A.4 Upper left Weibull shape parameter k as function of the normalized standard deviation,
r
3
/A of the time series. Upper right line of equal wind energy. Y-axis: Weibull scale parameter
A in m/s, x-axis: Weibull shape parameter k. Below energy potential
fr
om (
A.23
) (divided by
1
0
0), scale parameter A in m/s and shape parameter k as function of r
3
=½
u
for a mean wind speed
½
u
of 10 m/s
normal distribution. Figure
A.3
gives an example for A = 10 and k = 2.5. The
mean
value
of
this
sample
distribution
is
8.87 m/s,
the
maximum
of
the
distribution is near 8.15 m/s.
Equa
t
ions (
A.20
) and (
A.21
) imply that
½
u
=
A as well as r
2
/A
2
are functions of k
alone.
½
u
=
A is only weakly depending on k. It decreases from unity
a
t k = 1to
0.8856 at k = 2.17 and then slowly increases again. For k = 3,
½
u
=
A equals
0.89298. r
2
/A
2
is inversely related to k (Wieringa
1989
). We find r
3
/A = 1 for
k = 1, r
3
/A = 0.5
for
k = 1.853
and r
3
/A = 0.25
for
k = 4.081
(see
also
Fig.
A.4
upper left).
Higher central moments of the Weibull distribution, M
n
are given by (where n is
the order of the moment):
M
n
¼
A
n
C 1
þ
n
k
ð
A
:
22
Þ
The horizontal flux of kinetic energy of the wind per unit area of the rotor area
(usually called wind energy) E
wind
= 0.5 qv
3
is proportional to the third moment
of the Weibull distribution and can be easily calculated once A and k are known:
E
wind
¼
0
:
5qA
3
C 1
þ
3
k
ð
A
:
23
Þ
Search WWH ::

Custom Search