Geoscience Reference
In-Depth Information
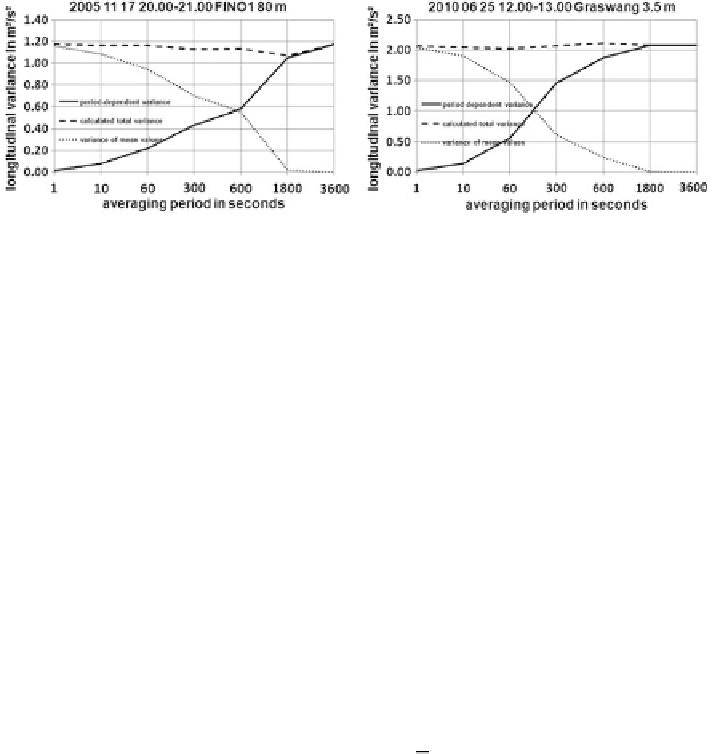
Fig. A.1 Variances measured at 80 m height at FINO1 on November 17, 2005 from 20 to 21 h
local time (left) and at 3.5 m height at Graswang (Upper Bavaria, Germany) on June 25, 2010
from 12 to 13 h local time (right). Full line shows variance depending on the averaging period,
dotted line shows the variance of the mean values and the dashed line gives the total variance
following Kaimal et al. (
1989
)
r
u
ð
t
;
T
Þ¼
q
u
0
2
ð
t
;
T
Þ
ð
A
:
4
Þ
Please note that variance and standard deviation depend on the length of the
averaging period T as well. Following Kaimal et al. (
1989
), the variance increases
with increasing length of the averaging period. In order to show this, assume that a
measurement period can be subdivided into several subperiods. The mean over the
whole period is to be denoted by angular brackets and the deviation from this mean
by a double prime. A triple prime denotes the deviation of an average over the
individual period from the average over the whole period. Then the variance of the
deviations from the average over the whole period is the mean of the variances of
the individual subperiods plus the variance of the individual mean values from the
subperiods:
u
00
2
¼
u
0
DE
þ
u
000
2
ð
A
:
5
Þ
Figure
A.1
gives two examples from 10 Hz wind measurements with a sonic
anemometer at 80 m at the FINO1 mast in the German Bight (left) and at a rural
TERENO site in Graswang (Upper Bavaria, Germany) at 3.5 m height which both
prove Kaimal's relation.
The analysis of the increase of the variance with increasing averaging periods
can be used to check whether the chosen averaging period is appropriate for the
data analysis. The example given on the right-hand side of Fig.
A.1
indicates that
in this case an averaging period of 1,800 s (30 min) is already sufficient to
determine the variance. The example on the left-hand side of Fig.
A.1
give hints
that even an averaging period of 3,600 s (1 h) might not be sufficient, because the
variance is still increasing. If the information of the mean wind speed is available,
the period of the strongest increase can be converted into the size of the most
energy-containing eddies in the turbulent flow. In the data sample shown in the


Search WWH ::

Custom Search