Geoscience Reference
In-Depth Information
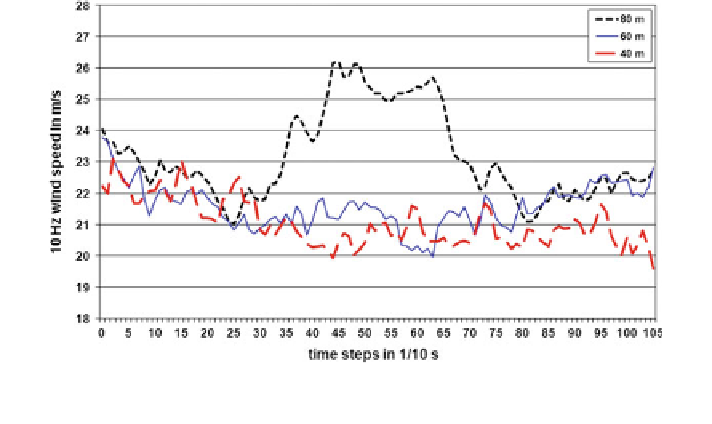
Fig. 5.30 Observed 10.5 s-gust event at FINO1 which was present at 80 m height only. The data
start at January 7, 2005, 12.52.32 UTC ? 1
Figure
5.29
compares selected, actually measured gust events with the ideali-
ezed definition of an EOG in the IEC standard. The selection procedure analysed
the high-resolution wind speed time series and marked all 10.5 s intervals where
the IEC EOG explained more than 85 % of the wind speed variance. The proce-
dure did not distinguish between positive and negative correlations. Actually, for
2005, 57 % of all selected gust events had a negative correlation with the EOG, i.e.
they were upside down Mexican hats (see also Fig.
5.31
). Another remarkable
feature was that the gust events did not always appear in all three measurement
heights (40, 60, and 80 m). Figure
5.30
shows an example where the gust event
was visible at 80 m height only.
Figure
5.31
displays the relative frequency of different amplitudes of these gust
events. The mean amplitude is about 12 % for wind speeds below 12 m/s and then
slightly increases to about 20 % for wind speeds of 20 m/s and above.
The above evaluations have been made for a 10.5 second-event as defined in the
IEC standard. Changing the event duration in the selection procedures showed that
10.5 second-events are not the most frequent events. 8 second-events occur 1.6
times as frequent as 10.5 second-events, while 14 second-events only occur 0.63
times as frequent.
5.5 Weibull Parameter
The measurements at the FINO1 platform in the German Bight allow for an
analysis of the variation of the Weibull parameters in a marine boundary layer with
height and season [see Bilstein and Emeis (
2010
) for further details]. Figure
5.32
Search WWH ::

Custom Search