Geoscience Reference
In-Depth Information
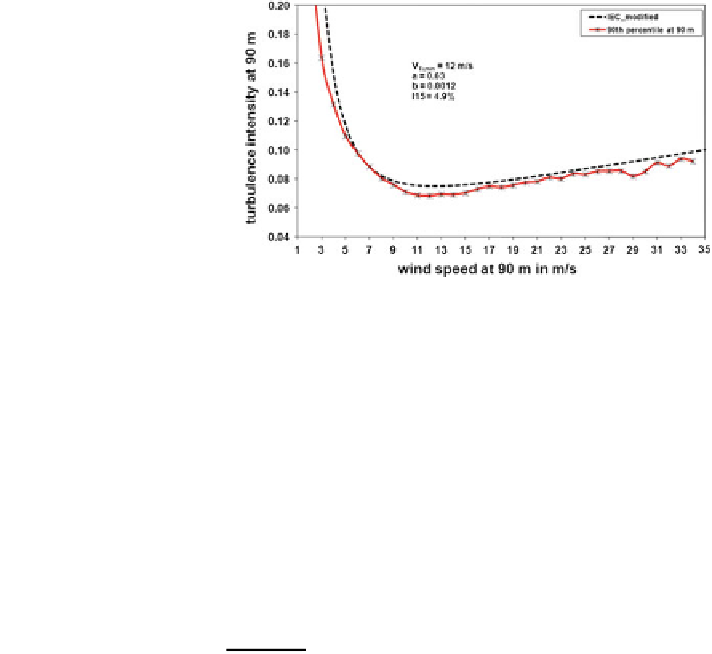
Fig. 5.23 Comparison of the
modified IEC relation for
turbulence intensity to the
90th percentile of turbulence
intensity at 90 m from Eq.
(
5.19
) with FINO1 data
speeds is partly due to the skewed and non-Gaussian distribution of measured
values of the standard deviation of the wind speed for wind speeds below 11 m/s
(see the discussion of Fig.
5.19
). The derivation of (
5.18
) had assumed a Gaussian
distribution for all wind speed bins.
At the upper heights of the FINO1 mast the values according to the standard lie
permanently above the measured values, while at the heights of 50 and 30 m the
measured values lie above the IEC-values for some wind speed bins. Especially at
the measuring height of 30 m influences to turbulence intensity (i.e. an increase of
turbulence intensity) from the FINO1 platform structure (for example the heli-
copter landing deck) cannot be excluded.
The data presented here suggest a modification of relation (
5.18
). A better fit is
possible from:
ln
ð
z
h
=
z
0
Þ
þ
2u
Iu
;
min
u
h
r
u90
¼
a
ð
1
:
44 m/s
Þ
I
15
þ
bu
h
ð
5
:
19
Þ
u
h
where u
Iu, min
is the wind speed at which the minimum turbulence intensity occurs.
a and b are two tunable factors. In Fig.
5.23
this better fit is shown where a = 0.63
and b = 0.0012 have been used.
5.4.2 Wind Speed Variances
In Eq. (
3.9
), the normalised wind speed-independent standard deviations of the
three wind components in the surface layer over flat and homogeneous terrain have
been given. In the MABL these values are no longer independent of wind speed,
because the surface roughness changes with wind speed. Figure
5.24
shows the
normalised variances for the longitudinal, transverse and vertical wind components
as function of wind speed at FINO1 in the German Bight. The curves in Fig.
5.24
u
2
= 3.61, r
2
/u
2
= 1.69). The normalised variances for 40, 60, and 80 m above the
sea surface approach to these values for medium wind speeds for the vertical
component and for very high wind speeds for the two horizontal components. For
Search WWH ::

Custom Search