Geoscience Reference
In-Depth Information
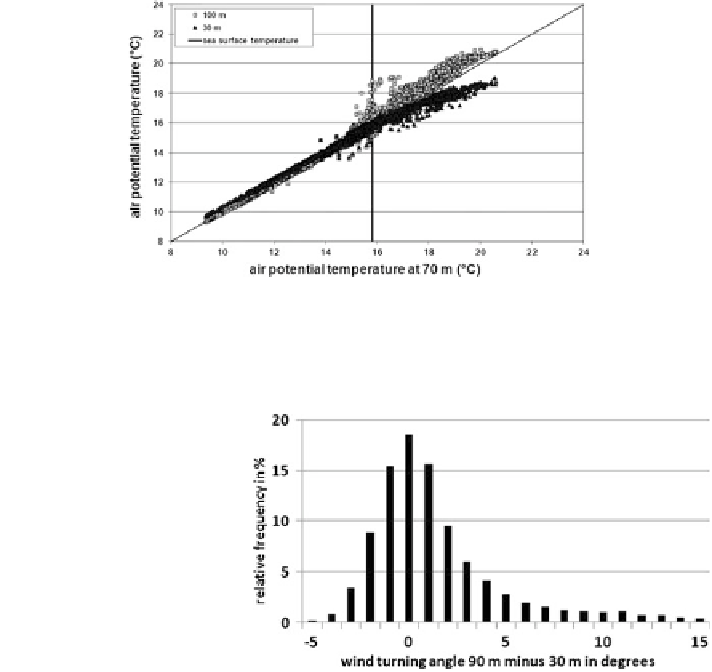
Fig. 5.16 Potential (see text) temperature in Cat30m(full triangles) and 100 m (open
squares) plotted against potential temperature at 70 m at FINO1 in the German Bight for October
2005. The bold vertical line gives the monthly mean sea surface temperature in C, the thin
slanted line gives potential temperature at 70 m
Fig. 5.17 Frequency
distribution of the difference
in wind direction between 30
and 90 m (dir
90 m
minus
dir
30 m
) height at FINO1 in
the German Bight for the year
2004
nearly 16 C, indicated by the vertical line in this figure. Situations with cold air
advection are to the left of the vertical line. Here air temperatures were below sea
surface temperature, i.e. unstable stratification prevailed. Vertical temperature
gradients are small due to the intense thermally induced vertical mixing. Situations
with warm air advection are to the right of the vertical line. Here air temperatures
are above sea surface temperature and stable stratification is found. Vertical
mixing is suppressed and considerable vertical temperature gradients can develop.
For an air temperature at 70 m being about 5 C larger than sea surface temper-
ature the vertical temperature spread between 30 and 100 m grows to about 2 C.
These extreme stable conditions are those where very large power law exponents
above 0.30 or even above 0.40 have been found (see Fig.
5.14
). The 90th per-
centile curve for stable stratification in Fig.
5.14
demonstrates that the occurrences
of these most extreme shear cases peak at mean wind speeds around 15 m/s.
As already mentioned above, offshore hub heights are usually in the Ekman part
of the MABL. This becomes obvious when looking at the wind direction differ-
ences between 30 and 90 m height measured at the meteorological mast FINO1
Search WWH ::

Custom Search