Geoscience Reference
In-Depth Information
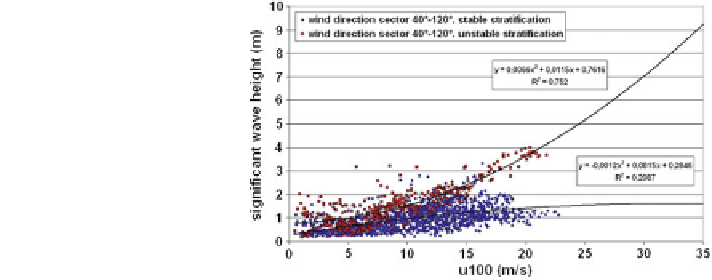
Fig. 5.9 Similar to lower left
frame of Fig.
5.8
, but plotted
versus wind speed.
Distinction has been made
between stable stratification
(small diamonds) and stable
stratification (larger squares)
whereas westerly gale force winds usually occur within a warm sector of cyclones
moving towards Northeast or East. This finding is supported by looking at the air-
sea temperature difference for the two cases displayed in Figs.
5.6
and
5.7
. During
the All Saints Day storm ''Britta'' on November 1, 2006, the winds came from the
northern sector (cf. Fig.
5.8
lower right) and the air temperature was several
degrees lower than the sea surface temperature. Therefore, this was a case with
unstable stratification. During the passage of the cyclone ''Erwin'' on January 8,
2005, the air temperature was somewhat higher than the sea surface temperature,
indicating a slightly stable stratification. Both storms brought extreme wind
speeds, but for the flow pattern and the thermal stratification, they were typical for
higher winds from these sectors. This is the reason why we do not find notable
differences between stable and unstable situations in these two sectors in the way
we had found it in the other two sectors. Thus, the northern sector can be seen as a
selection of weather situations with usually unstable stratification and the western
sector as a selection with usually stable stratification, at least in cases with stronger
winds. This stratification difference between these two sectors explains why the
wave heights in the western sector are much lower than in the northern sector,
although fetch and duration are large in both sectors.
5.1.3 Extreme Wave Heights
Emeis and Türk (
2009
) also estimated the possible extreme wave heights for the
four sectors in Fig.
5.8
and Table
5.1
using the techniques described in Appendix
A.3 after Eq. (A.32). In Fig.
5.10
we plotted the cumulative frequencies of all
wave heights (in 1 m bins) in the different sectors (keeping the differentiation for
thermal stability in the southern and eastern sector). The 50 year threshold in this
plot refers to about 2,000 values a year which correspond to the number of data per
year in the most populated wind direction sector [for N = 2,000 the 50 year
threshold y =-ln (-ln(1 - 1/(50 9 N))) is about 11.5]. Although the most fre-
quent wind direction is from southwest, the most populated wind sector is the
Search WWH ::

Custom Search