Geoscience Reference
In-Depth Information
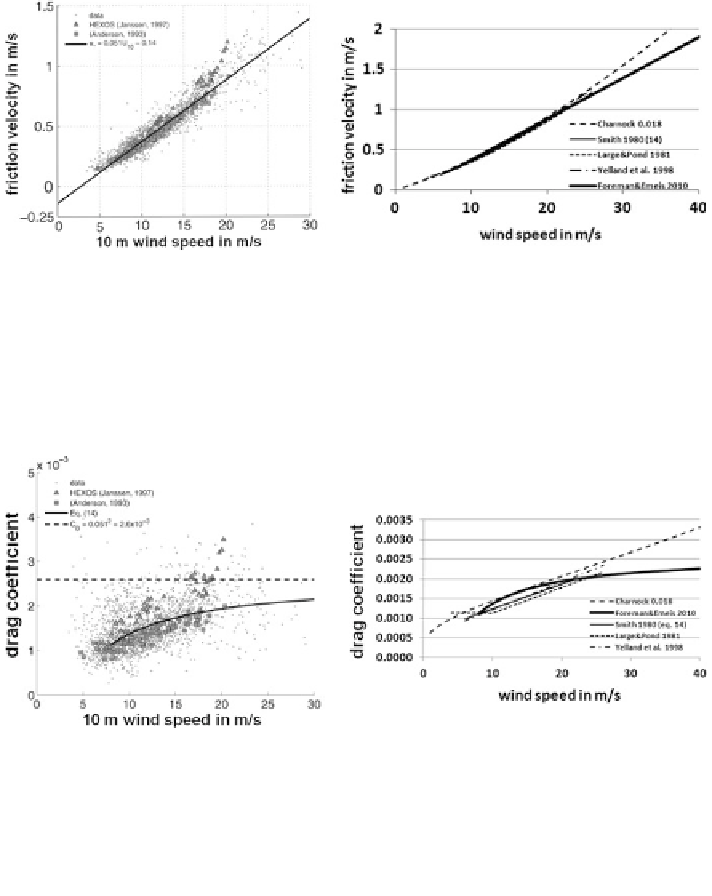
Fig. 5.3 Friction velocity in the marine surface layer, u
*
plotted against 10 m wind speed, u
10
.
Left: from literature data listed in Table 1 of Foreman and Emeis (
2010
). For u
10
[ 8 m/s and
u
*
[ 0.27 m/s a straight line [see Eq. (
5.8
)] is fitted to data in this range. The HEXOS results as
reported by Janssen (
1997
) are shown by triangles; the measurements of Anderson (
1993
) are
indicated by squares (from Foreman and Emeis
2010
). Right: functional dependencies of friction
velocity on wind speed: bold line: Eq. (
5.8
), dashed line: Eq. (
5.3
) using a = 0.018, thin line: Eq.
(
5.4
), dotted line: Eq. (
5.5
), dash-dotted line: Eq. (
5.6
)
Fig. 5.4 Drag coefficient of the sea surface, C
D
plotted against 10 m-wind speed, u
10
. Left: from
literature data listed in Table 1 of Foreman and Emeis (
2010
). For u
10
[ 8 m/s and u* [ 0.27 m/
s a curve [see Eq. (
5.9
)] is fitted to data in this range. The HEXOS results as reported by Janssen
(
1997
) are shown by triangles; the measurements of Anderson (
1993
) are indicated by squares
(from Foreman and Emeis
2010
). Right: functional dependencies of drag coefficient on wind
speed: bold line: Eq. (
5.9
), dashed line: Eq. (
5.3
) using a = 0.018, thin line: Eq. (
5.4
), dotted line:
Eq. (
5.5
), dash-dotted line: Eq. (
5.6
)
Differences in measured drag coefficients between independent studies are most
probably a function of the state of the sea (Donelan
1990
) such as the wave
steepness or slope (e.g., Hsu
1974
) and wave age (e.g., Maat et al.
1991
). For
example, the drag coefficient is thought to increase with younger waves (i.e.
decreasing wave age) (Smith et al.
1992
). The precise dependence of the drag
coefficient on one or more of these tools is an ongoing area of research in air-sea
interaction (Sullivan and McWilliams
2010
).
Search WWH ::

Custom Search