Geoscience Reference
In-Depth Information
is estimated from mean temperature. Figure 4.7 illus-
trates this for stations in western, central and eastern
Britain (compare Figure 10.22). In the winter months
there is an excess of precipitation over evaporation; this
goes to recharging the soil moisture, and further surplus
runs off. In summer, when evaporation exceeds pre-
cipitation, soil moisture is used initially to maintain
evaporation at the potential value, but when this store is
depleted there is a water deficiency, as shown in Figure
4.7 for Southend.
In the United States, monthly moisture conditions are
commonly evaluated on the basis of the Palmer Drought
Severity Index (PDSI). This is determined from accumu-
lated weighted differences between actual precipitation
and the calculated amount required for evapotranspi-
ration, soil recharge and runoff. Accordingly, it takes
account of the persistence effects of drought situations.
The PDSI ranges from
D CONDENSATION
Condensation is the direct cause of all the various forms
of precipitation. It occurs as a result of changes in air
volume, temperature, pressure or humidity. Four mech-
anisms may lead to condensation: (1) the air is cooled
to dew-point but its volume remains constant; (2) the
volume of the air is increased without addition of heat;
this cooling occurs because adiabatic expansion causes
energy to be consumed through work (see Chapter 5);
(3) a joint change of temperature and volume reduces
the moisture-holding capacity of the air below its
existing moisture content; or (4) evaporation adds
moisture to the air. The key to understanding conden-
sation lies in the fine balance that exists between these
variables. Whenever the balance between one or more
of these variables is disturbed beyond a certain limit,
condensation may result.
The most common circumstances favouring conden-
sation are those producing a drop in air temperature;
namely contact cooling, radiative cooling, mixing
of airmasses of different temperatures and dynamic
cooling of the atmosphere. Contact cooling occurs
-4
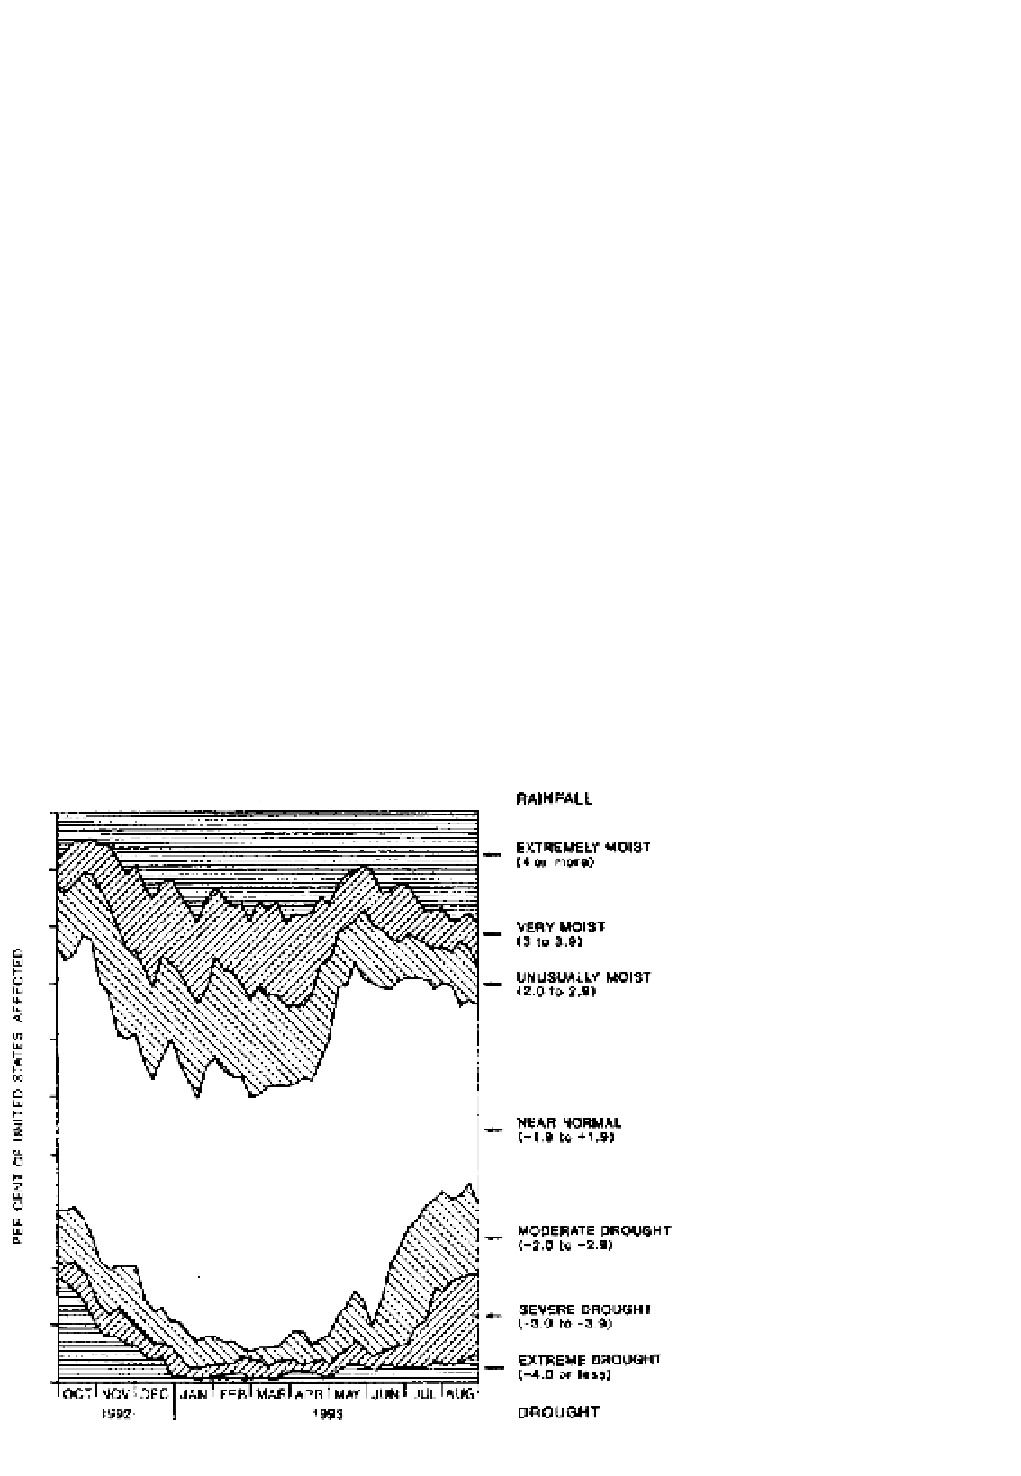
(extreme drought). Figure 4.8 indicates an oscillation
between drought and unusually moist conditions in
the continental USA during the period October 1992 to
August 1993.
≥
4 (extremely moist) to
≤
RAINFALL
0
EXTREMELY MOIST
(4 or more)
10
VERY MOIST
(3 to 3.9)
UNUSUALLY MOIST
(2.0 to 2.9)
20
30
40
50
NEAR NORMAL
(-1.9 to +1.9)
40
30
Figure 4.8
Percentage of the conti-
nental USA affected by wet spells or
drought, based on the Palmer Index
(see scale on right), during the period
October 1992 to August 1993.
Sources
: US Climate Analysis Center and
Lott (1994). Reprinted from
Weather
, by
permission of the Royal Meteorological
Society. Crown copyright ©.
MODERATE DROUGHT
(-2.0 to -2.9)
20
SEVERE DROUGHT
(-3.0 to -3.9)
EXTREME DROUGHT
(-4.0 or less)
10
0
OCT NOV DEC JAN
FEB MAR APR MAY JUN
JUL AUG
DROUGHT
1992
1993