Geoscience Reference
In-Depth Information
B HUMIDITY
vapour pressure - the saturation value (i.e. 100 per cent
relative humidity); consequently we may expect the
distribution of mean vapour content to reflect this
control. In January, minimum values of 1-2 mm
(equivalent depth of water) occur in northern continental
interiors and high latitudes, with secondary minima of
5-10 mm in tropical desert areas, where there is sub-
siding air (Figure 4.3). Maximum vapour contents
of 50-60 mm are over southern Asia during the summer
monsoon and over equatorial latitudes of Africa and
South America.
Another important measure is
relative humidity
(
r
),
which expresses the actual moisture content of a sample
of air as a percentage of that contained in the same
volume of saturated air at the same temperature. The
relative humidity is defined with reference to the mixing
ratio, but it can be determined approximately in several
ways:
1 Moisture content
Atmospheric moisture comprises water vapour, and
water droplets and ice crystals in clouds. Moisture con-
tent is determined by local evaporation, air temperature
and the horizontal atmospheric transport of moisture.
Cloud water, on average, amounts to only 4 per cent
of atmospheric moisture. The moisture content of
the atmosphere can be expressed in several ways, apart
from the vapour pressure (p. 24), depending on which
aspect the user wishes to emphasize. The total mass
of water in a given volume of air (i.e. the density of the
water vapour) is one such measure. This is termed
the
absolute humidity
(r
w
) and is measured in grams
per cubic metre (g m
-3
). Volumetric measurements are
seldom used in meteorology and more convenient is the
mass mixing ratio
(
x
). This is the mass of water vapour
in grams per kilogram of dry air. For most practical
purposes, the
specific humidity
(
q
) is identical, being
the mass of vapour per kilogram of air, including its
moisture.
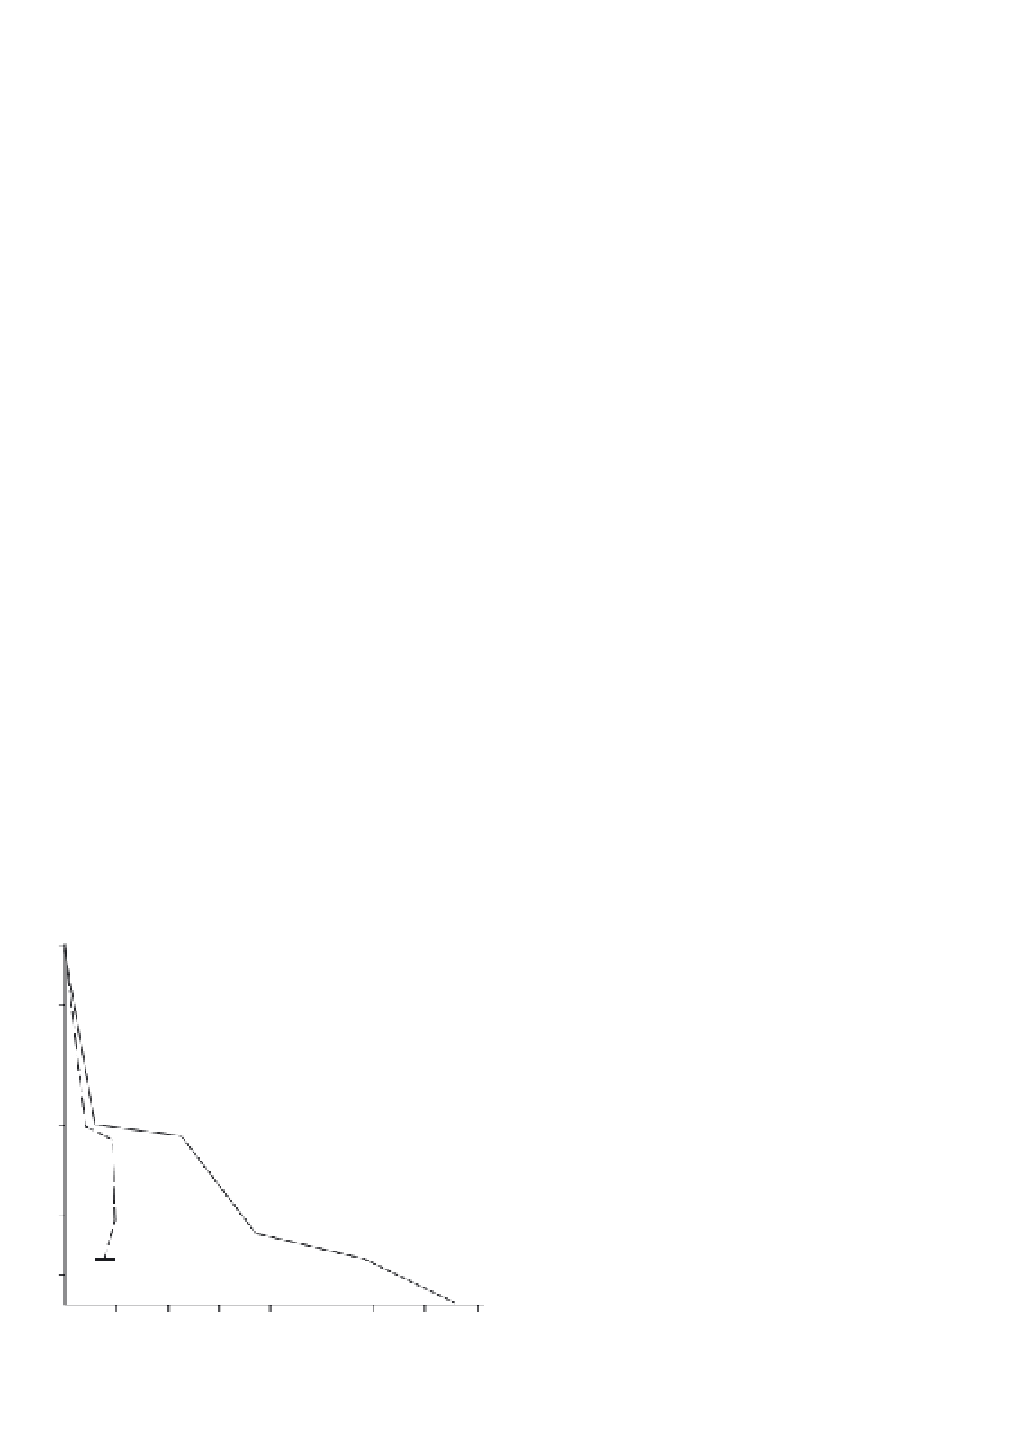
More than 50 per cent of atmospheric moisture
content is below 850 mb (approximately 1450 m) and
more than 90 per cent below 500 mb (5575 m). Figure
4.2 illustrates typical vertical distributions in spring in
middle latitudes. It is also apparent that the seasonal
effect is most marked in the lowest 3000 m (i.e. below
700 mb). Air temperature sets an upper limit to water
x
q
e
r
= —
100 < —
100 < —
100
x
s
q
s
e
s
where the subscript
s
refers to the respective saturation
values at the same temperature;
e
denotes vapour
pressure.
A further index of humidity is the dew-point tem-
perature. This is the temperature at which saturation
occurs if air is cooled at constant pressure without
addition or removal of vapour. When the air temperature
and dew point are equal the relative humidity is 100 per
cent, and it is evident that relative humidity can also be
determined from:
mb
400
500
e
s
at dew-point
————————
100
e
s
at air temperature
The relative humidity of a parcel of air will change if
either its temperature or its mixing ratio is changed. In
general, the relative humidity varies inversely with
temperature during the day, tending to be lower in the
early afternoon and higher at night.
Atmospheric moisture can be measured by at least
five types of instrument. For routine measurements
the
wet-bulb thermometer
is installed in a louvred
instrument shelter (Stevenson screen). The bulb of the
standard thermometer is wrapped in muslin, which is
kept moist by a wick from a reservoir of pure water. The
700
Tucson
850
Miami
950
Surface
2
4
6
8
10
12
14
16
Mixing ratio (g/kg)
Figure 4.2
The vertical variation of atmospheric vapour content
(g/kg) at Tucson, AZ and Miami, FL at 12 UTC on 27 March 2002.