Geoscience Reference
In-Depth Information
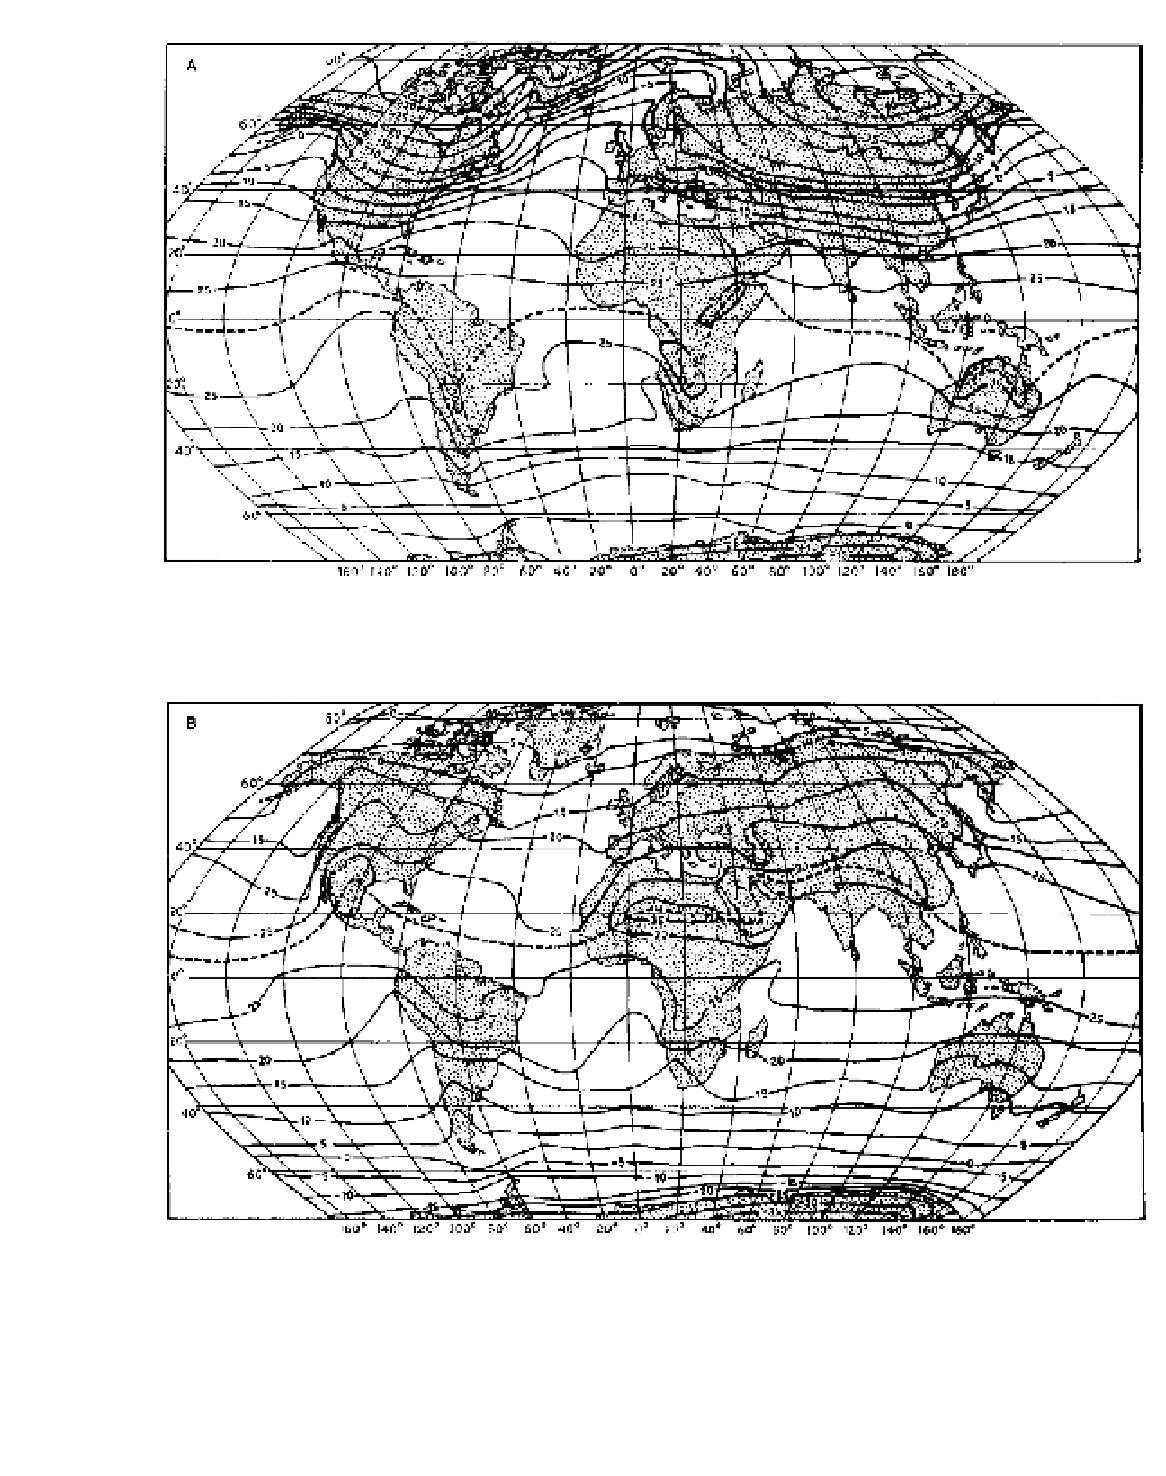
Figure 3.11
(A) Mean sea-level temperatures (°C) in January. The position of the thermal equator is shown approximately by the
line dashes. (B) Mean sea-level temperatures (°C) in July. The position of the thermal equator is shown approximately by the line dashes.