Geoscience Reference
In-Depth Information
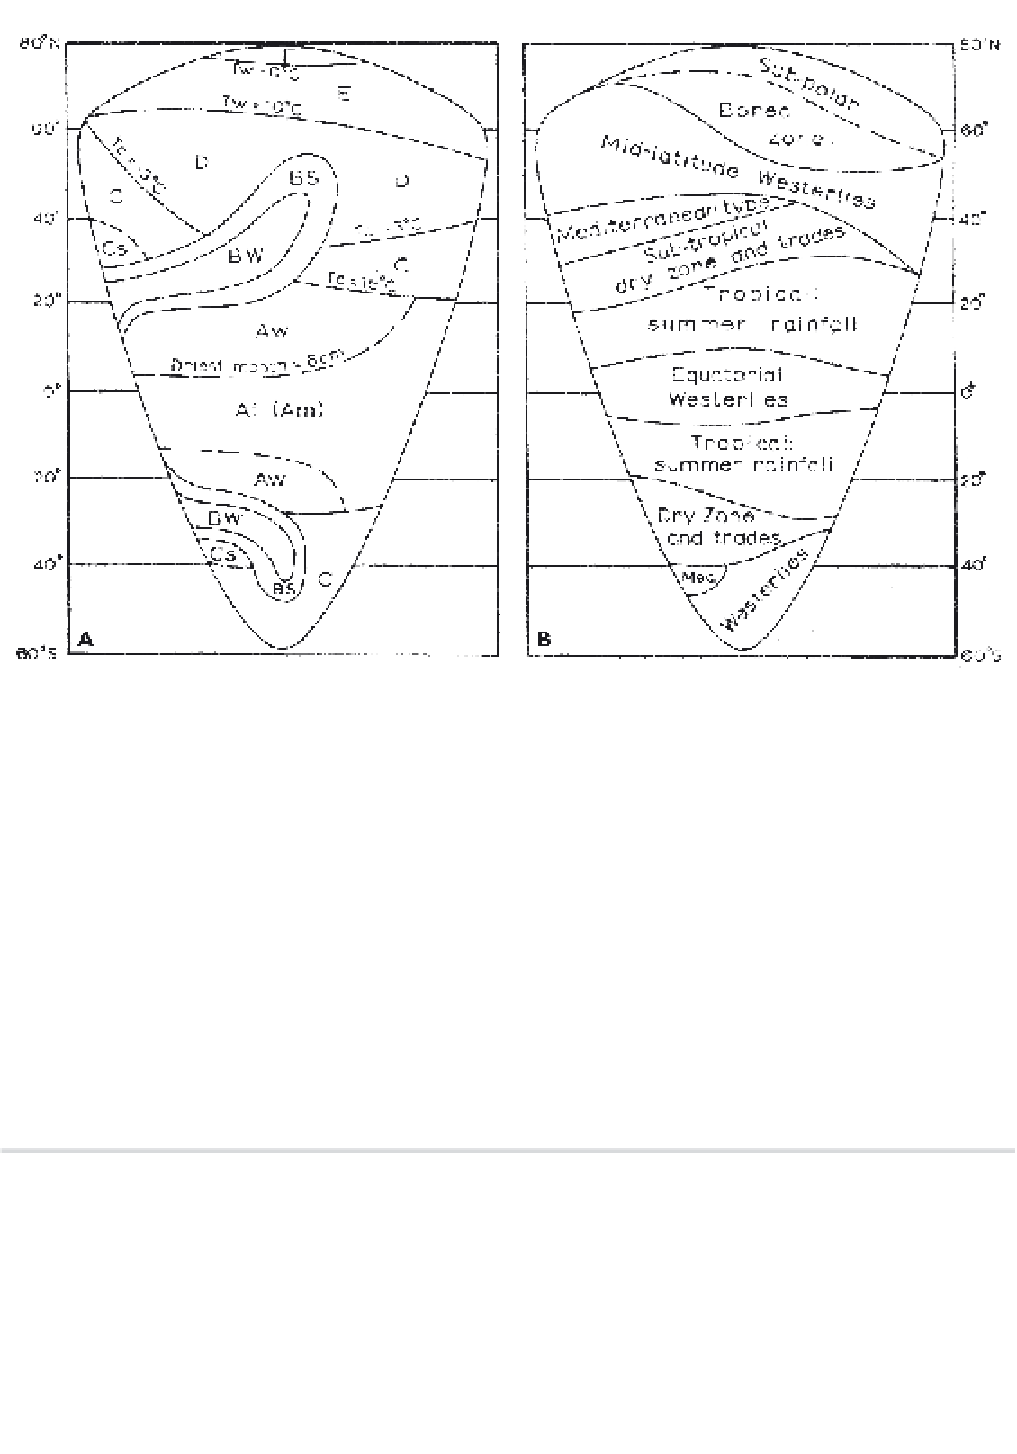
Figure A1.2
(A) The distribution of the major Köppen climatic types on a hypothetical continent of low and uniform elevation. Tw
= mean temperature of warmest month; Tc = mean temperature of coldest month. (B) The distribution of Flohn's climatic types on
a hypothetical continent of low and uniform elevation (see Note 1).
Source
: From Flohn (1950). Copyright ©
Erdkunde
. Published by permission.
Table A1.1
Thornthwaite's climatic classification.
PE
Im (1955 system)
*
mm
in
Climatic type
>100
Perhumid (
A
)
>1140
>44.9
Megathermal (
A
´)
20 to 100
Humid (
B
1
to
B
4
)
570 to 1140
22.4 to 44.9
Mesothermal (
B
´
1
to
B
´
4
)
0 to 20
Moist subhumid (
C
2
)
285 to 570
11.2 to 22.4
Microthermal (
C
´
1
to
C
´
2
)
-33 to 0
Dry subhumid (
C
1
)
142 to 285
5.6 to 11.2
Tundra (
D
´)
-67 to -33
Semi-arid (
D
)
<142
<5.6
Frost (
E
´)
-100 to -67
Arid (
E
)
Note
:
*
Im = 100(S - D)/PE
is equivalent to 100(
r/PE
- 1), where
r
= annual precipitation.
called the
radiational index of dryness
. It has a value of
less than unity in humid areas and greater than unity in
dry areas. Boundary values of
R
o
/
L
r are: Desert (>3.0);
Semi-desert (2.0 to 3.0); Steppe (1.0 to 2.0); Forest (0.33
to 1.0); Tundra (<0.33). In comparison with the revised
Thornthwaite index (
Im
= 100(
r
/
PE
- 1)), note that
Im
= 100(
L
r/
R
o
- 1) if all the net radiation is used for
evaporation from a wet surface (i.e. no energy is
transferred into the ground by conduction or into the air
as sensible heat). A general world map of Ro/Lr has
appeared, but over large parts of the earth there are few
measurements of net radiation.
Energy fluxes were used by Terjung and Louie
(1972) to categorize the magnitude of energy input (net