Geoscience Reference
In-Depth Information
uncertain component even as to sign of the contri-
bution.
Temperature change
6
A1FI
A1B
B2
Several models
all SRES
envelope
Model ensemble
all SRES
envelope
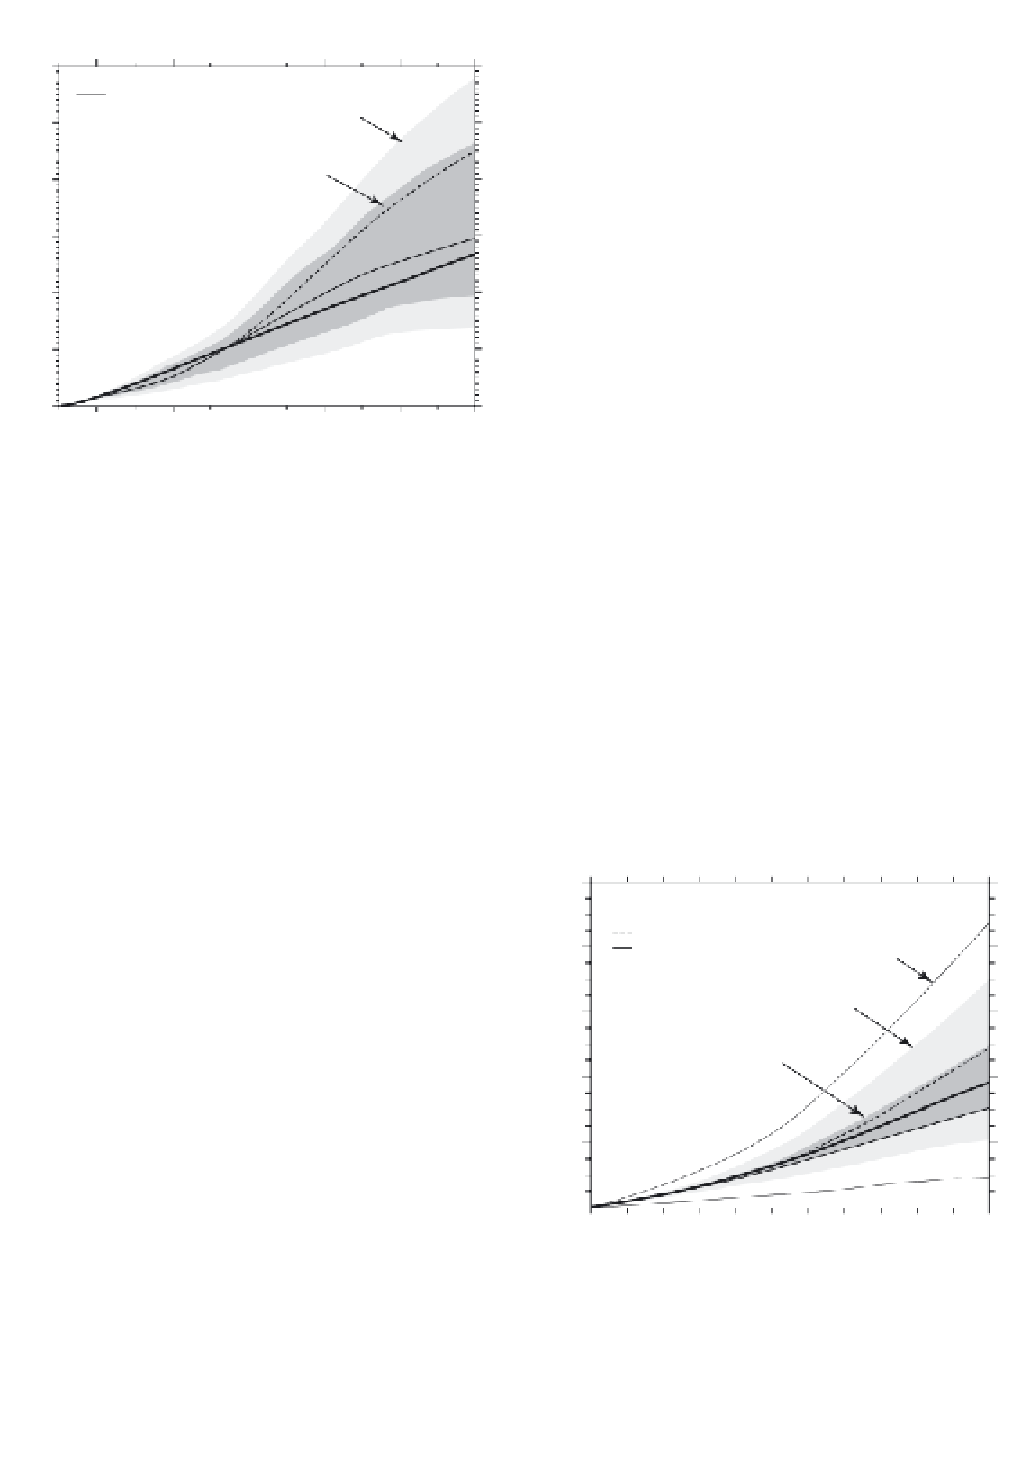
Figure 13.23 shows sea level rise up to
AD
2100
for the selected SRES-based scenarios in Figure
13.17. The projected mean sea-level rise is close to 0.5
m, with a range from 0.20 to 0.86 m, based on coupled
atmosphere-ocean GCM experiments.
This is because of the long lags in the responses
of the huge oceans and ice sheet masses, but, by the
same token, sea-level will continue to rise long after
atmospheric forcing mechanisms have stabilized.
Uncertainties regarding sea-level rise are still con-
siderable, mainly because of our lack of knowledge
concerning the behaviour of the large ice sheets, espe-
cially Antarctica. There is even the possibility that
increased global warming may introduce a tendency for
sea-level to
fall
due to increased snow accumulation
rates in high latitudes. Another outside possibility is that
a rise in sea-level might cause the West Antarctic ice
sheet to be buoyed up and melt bodily (not just around
the edges, as in the past) and cause a further catastrophic
sea-level rise but spread over several hundred years.
Further considerations are the possible effects of
extreme sea-level events (such as tides, waves and storm
surges), but these are extremely difficult to predict.
5
4
3
2
1
0
2000
2020
2040
2060
2080
2100
Year
Figure 13.22
IPCC simulated increase in global mean temper-
atures for the scenarios, shown in Figure 13.17, together with the
envelope of SRES projections and that for several models.
Source
: Adapted from Houghton
et al
. (2001). Reproduced by
permission of the IPCC and Cambridge University Press.
• Changes in the attraction of sun and moon.
•
Changes in the velocity of ocean currents
.
Over the past 100 years, the estimated rise of global
sea-levels was by 10 to 25 cm or more. This is attributed
to the following causes:
1
Thermal expansion of ocean waters (0.3 to 0.7
mm/yr; i.e. possibly 50 per cent or more). This is
difficult to estimate due to lack of knowledge of deep
ocean temperature change and the effects of oceanic
circulations.
Sea-level rise
1.0
Sce
narios
A1B
A1FI
B1
All SRES envelope
including land-ice
uncertainty
0.8
2
Glacier and small ice-cap melting (0.2-0.4 mm/yr;
i.e. possibly 30 per cent). This is poorly known
before 1960.
Several models
all SRES
envelope
Model average
all SRES
envelope
0.6
3
Greenland ice sheet thinning (0.0 to 0.1 mm/yr). This
is poorly constrained although a good airborne
altimetric measurement network is now in place.
0.4
0.2
4
Antarctic ice sheet thickening (-0.2 to 0.0 mm/yr).
This is very uncertain; the Antarctic ice sheet is a
large and complex system with its own internal
mechanisms and a mass balance that changes slowly.
Some workers believe the balance is positive, which
would offset sea-level rise. This source has probably
not yet contributed greatly to the global sea-level rise
but may do so in the future.
0.0
2000
2020
2040
2060
2080
2100
Year
Figure 13.23
Predictions of sea-level rise (m) to the year
2100, for the scenarios shown in Figure 13.17 together with the
envelope of SRES projections and that for several models.
Source
: Houghton
et al
. (2001). Reproduced by permission of
the IPCC and Cambridge University Press. (Policy-makers' summary,
p. 14, fig 5e.)
5
Terrestrial water storage changes due to human
activities (-1.1 to 0.4 mm/yr). This is the most