Geoscience Reference
In-Depth Information
90˚N
60˚N
30˚N
0
30˚S
60˚S
90˚S
180˚
90˚W
0˚
90˚E
180˚
-1.5
-1
-.5
0
.5
1
1.5
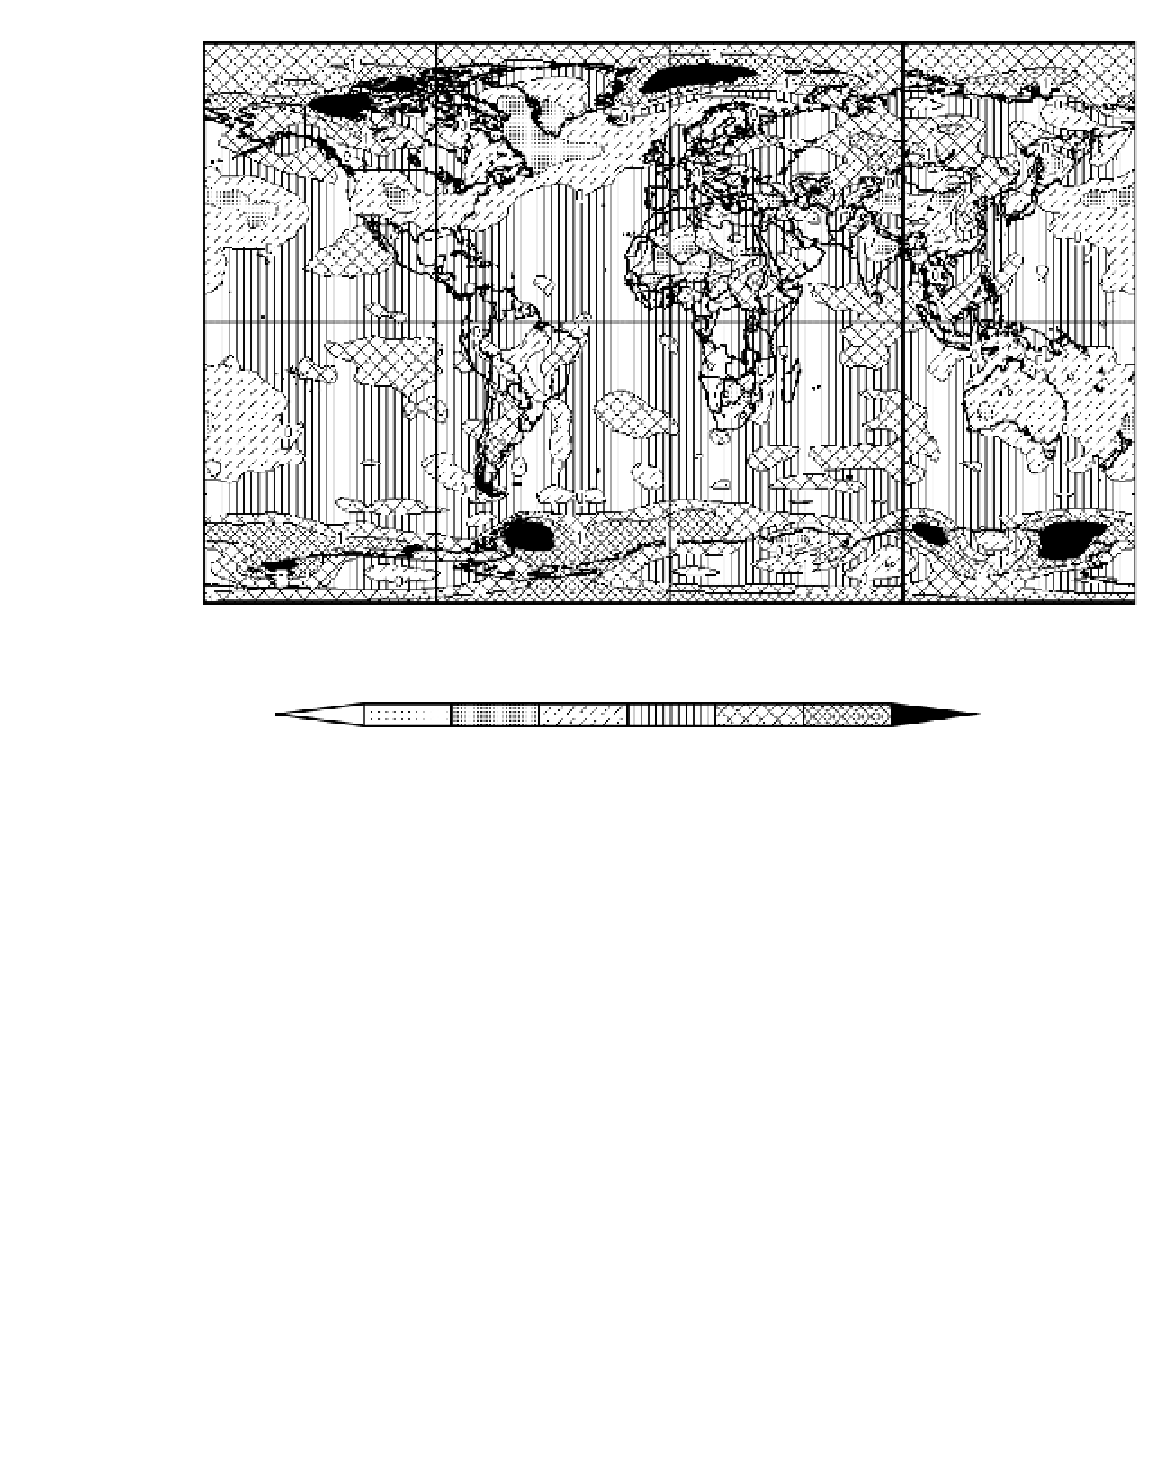
Figure 13.9
The global difference in 1000-mb air temperature between 1976 and 2000 and 1950 and 1975. The contour interval
is 0.5°C.
Source
: Climate Diagnostics Center, CIRES, University of Colorado, Boulder.
and sea ice, is apparent in northern high latitudes for
the interval 1950 to 1975 and 1975 to 2000 (see Figure
13.9). In central England, the warming is evidenced by
the increasing length of the growing season (daily mean
temperature >5°C for five days in succession). The
season lengthened by twenty-eight days over the
twentieth century and was about 270 days in the 1990s
compared with around 230 to 250 days in the eighteenth
and nineteenth centuries.
A further tendency of the past fifty years or so is a
decrease in the diurnal temperature range; night-time
minimum temperatures increased by 0.8°C during
1951 to 1990 over at least half of the northern land areas
compared with only 0.3°C for daytime maximum
temperatures. This appears to be mainly a result of
increased cloudiness, which, in turn,
may
be a response
to increased greenhouse gases and tropospheric
aerosols. However, the linkages are not yet adequately
determined.
Precipitation records are much more difficult to
characterize. Since the mid-twentieth century, decreases
dominate much of the tropics and subtropics from North
Africa eastward to Southeast Asia and Indonesia (Figure
13.10). Many of the dry episodes are associated with El
Niño events. Equatorial South America and Australasia
also show ENSO influences. The Indian monsoon area
shows wetter and drier intervals; the drier periods are
evident in the early twentieth century and during 1961
to 1990.
The West African records for this century (Figure
13.11) show a tendency for both wet and dry years to
occur in runs of up to ten to eighteen years. Precipitation
minima were experienced in the 1910s, 1940s and post-
1968, with intervening wet years, in all of sub-Saharan
West Africa. Throughout the two northern zones outlined
in Figure 13.11, means for 1970 to 1984 were generally
<50 per cent of those for 1950 to 1959, with deficits
during 1981 and 1984 equal to or exceeding those of the