Geoscience Reference
In-Depth Information
Figure 13.7
Long-term records of
winter (December to February) and
summer (June to August) temperatures
over the past 200 years for a number of
northern hemisphere stations, smoothed
with a ten-year Gaussian filter.
Source
: After Parker
et al
. (1996).
Reproduced from
Weather
by permission
of the Royal Meteorological Society,
copyright ©.
1959; this was partly compensated by a slight warm-
ing in the western United States, eastern Europe and
Japan.
4
The mid-1970s to 2000
, during which there was a
marked overall warming of about 0.5°C, except for
areas of the North and South Pacific, North Atlantic,
Europe, Amazonia and Antarctica (see Figure 13.9).
In a few regions the warming exceeded 1.0°C.
Based on balloon soundings, the global tropos-
pheric temperature increase (up to 8 km) since the
late 1950s has been about 0.1°C/decade, similar to
that at the surface. However, the satellite sounding
record of tropospheric temperatures shows a lesser
rate of warming than the surface air temperature:
only 0.05° ±0.10 C/decade versus 0.15 ± 0.05 °C/
decade. The differences are mainly in the tropics
and subtropics and are not fully explained. Reasons
include the effects of ENSO events and atmospheric
aerosols. In the tropics, the tropospheric warming
(1976 to 1990) exceeded that at the surface, while
the opposite was found in high latitudes (except the
Arctic).
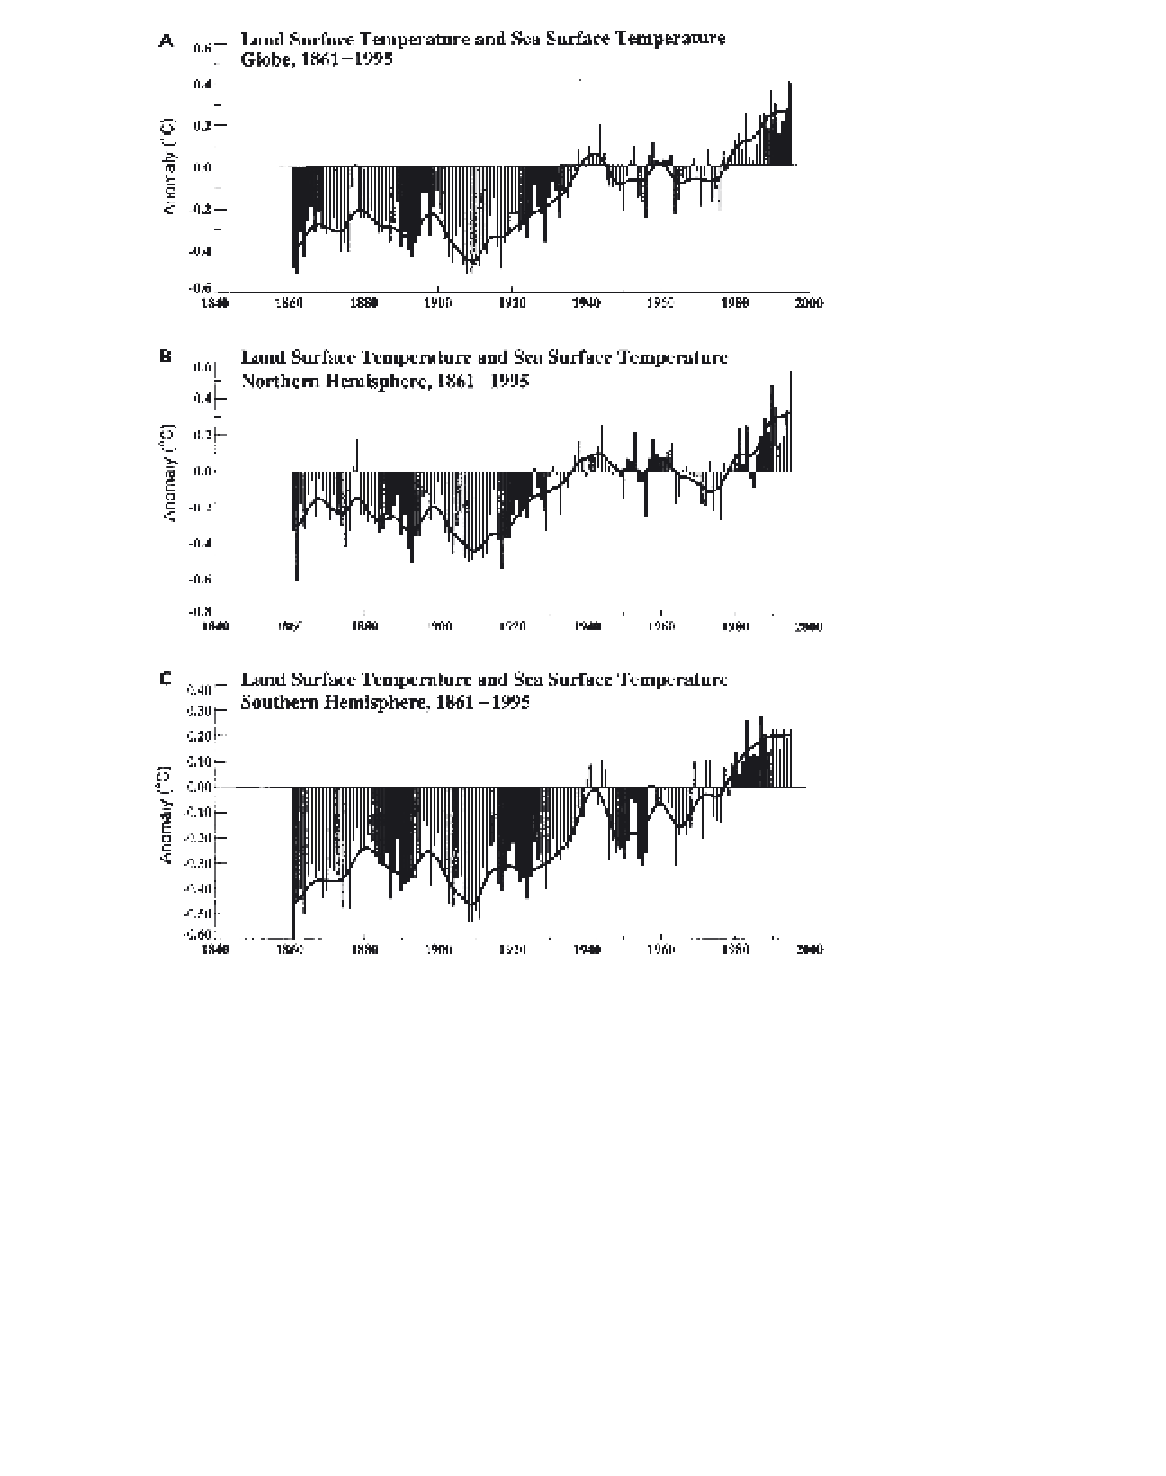
Global temperatures during the past decade reached
the highest levels on record and probably for the past
millennium. The warmest years on record were 1998,
2001, 1995 and 1990, in that order (see Figures 13.6 and
13.8). In the southern hemisphere, where the twentieth-
century warming was delayed, there has been a rather
irregular warming since 1930 of about 0.5°C. The

