Geoscience Reference
In-Depth Information
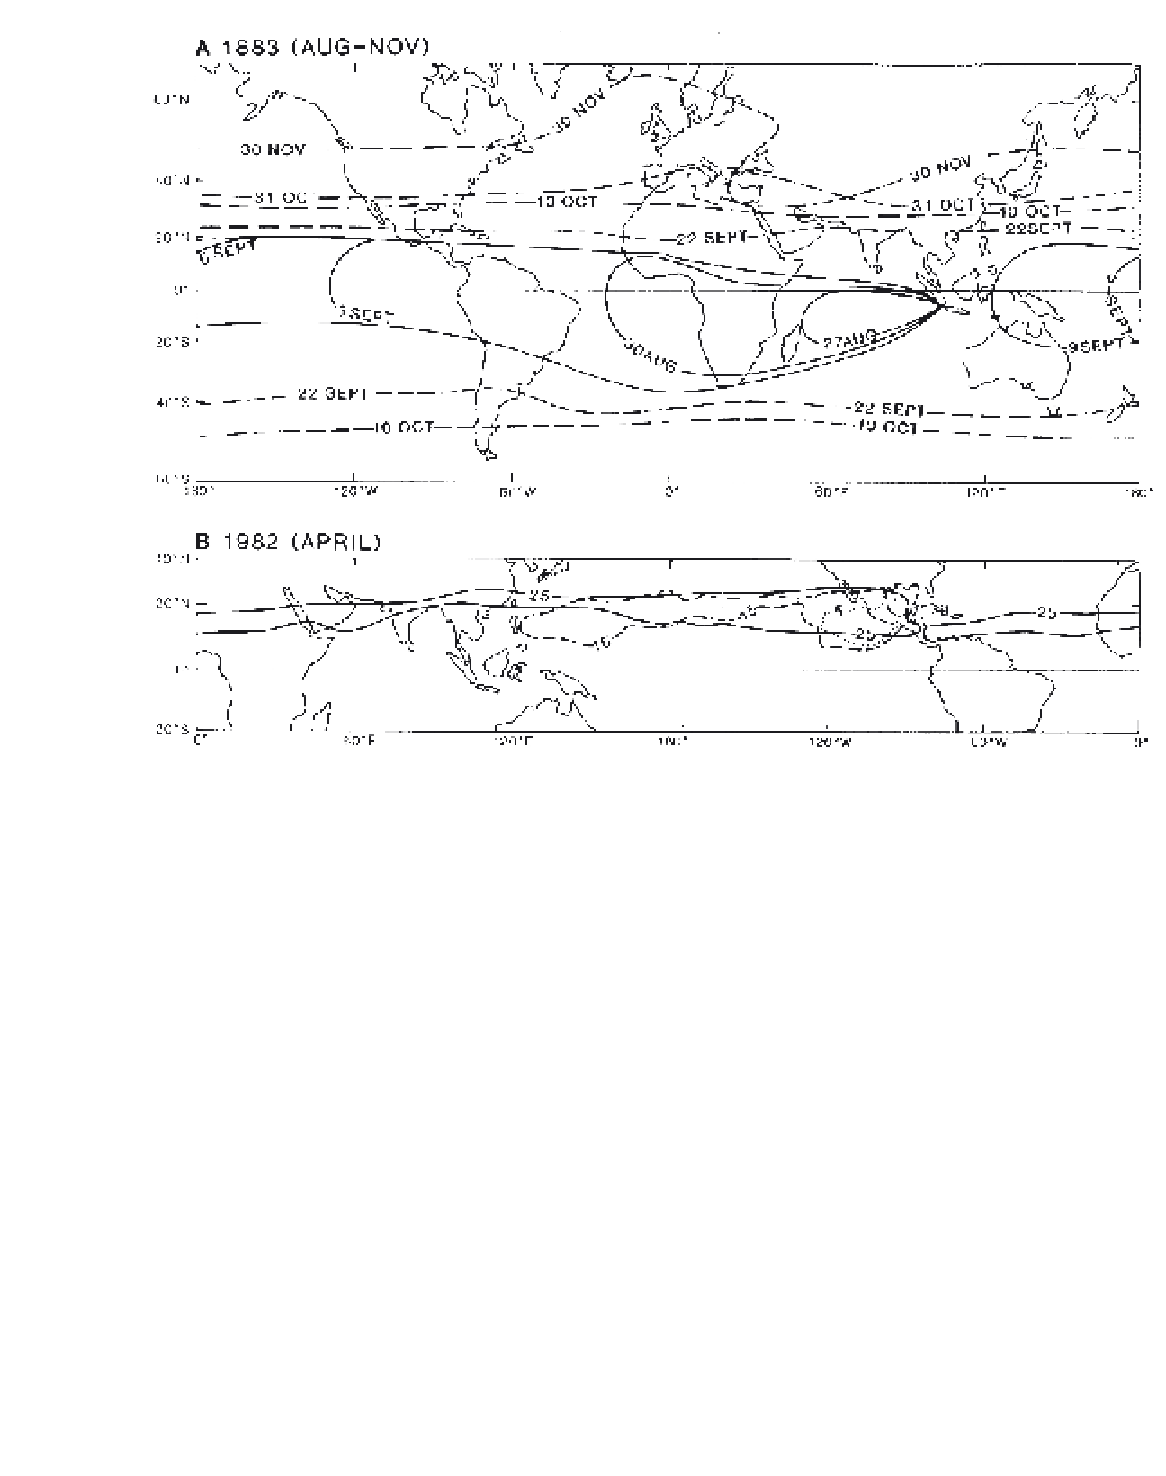
Figure 2.12
The spread of volcanic material in the atmosphere following major eruptions. (A) Approximate distributions of observed
optical sky phenomena associated with the spread of Krakatoa volcanic dust between the eruption of 26 August and 30 November
1883. (B) The spread of the volcanic dust cloud following the main eruption of the El Chichón volcano in Mexico on 3 April 1982.
Distributions on 5, 15 and 25 April are shown.
Sources
: Russell and Archibald (1888), Simkin and Fiske (1983), Rampino and Self (1984), Robock and Matson (1983). (A) by permission of the
Smithsonian Institution; (B) by permission of Scientific American Inc.
and they are calculated for mean sea-level to eliminate
the effect of station elevation. This third correction is
the most significant, because near sea-level pressure
decreases with height by about 1 mb per 8 m. A fictitious
temperature between the station and sea-level has
to be assumed and in mountain areas this commonly
causes bias in the calculated mean sea-level pressure
(see Note 4).
The mean sea-level pressure (
p
0
) can be estimated
from the total mass of the atmosphere (
M
, the mean
acceleration due to gravity (
g
0
) and the mean earth
radius (
R
):
expression (
M
= 5.14
10
18
kg,
g
0
= 9.8 ms
-2
,
R
E
= 6.36
10
6
m), we find
p
0
= 10
5
kg ms
-2
= 10
5
Nm
-2
, or 10
5
Pa. Hence the mean sea-level pressure is approxi-
mately 10
5
Pa or 1000 mb. The global mean value is
1013.25 mb. On average, nitrogen contributes about
760 mb, oxygen 240 mb and water vapour 10 mb. In
other words, each gas exerts a partial pressure inde-
pendent of the others.
Atmospheric pressure, depending as it does on the
weight of the overlying atmosphere, decreases logarith-
mically with height. This relationship is expressed by
the
hydrostatic equation
:
P
0
=
g
0
(
M
/4
π
R
E
2
)
∂
p
-- = -
g
ρ
where the denominator is the surface area of a spheri-
cal earth. Substituting appropriate values into this
∂
z