Geoscience Reference
In-Depth Information
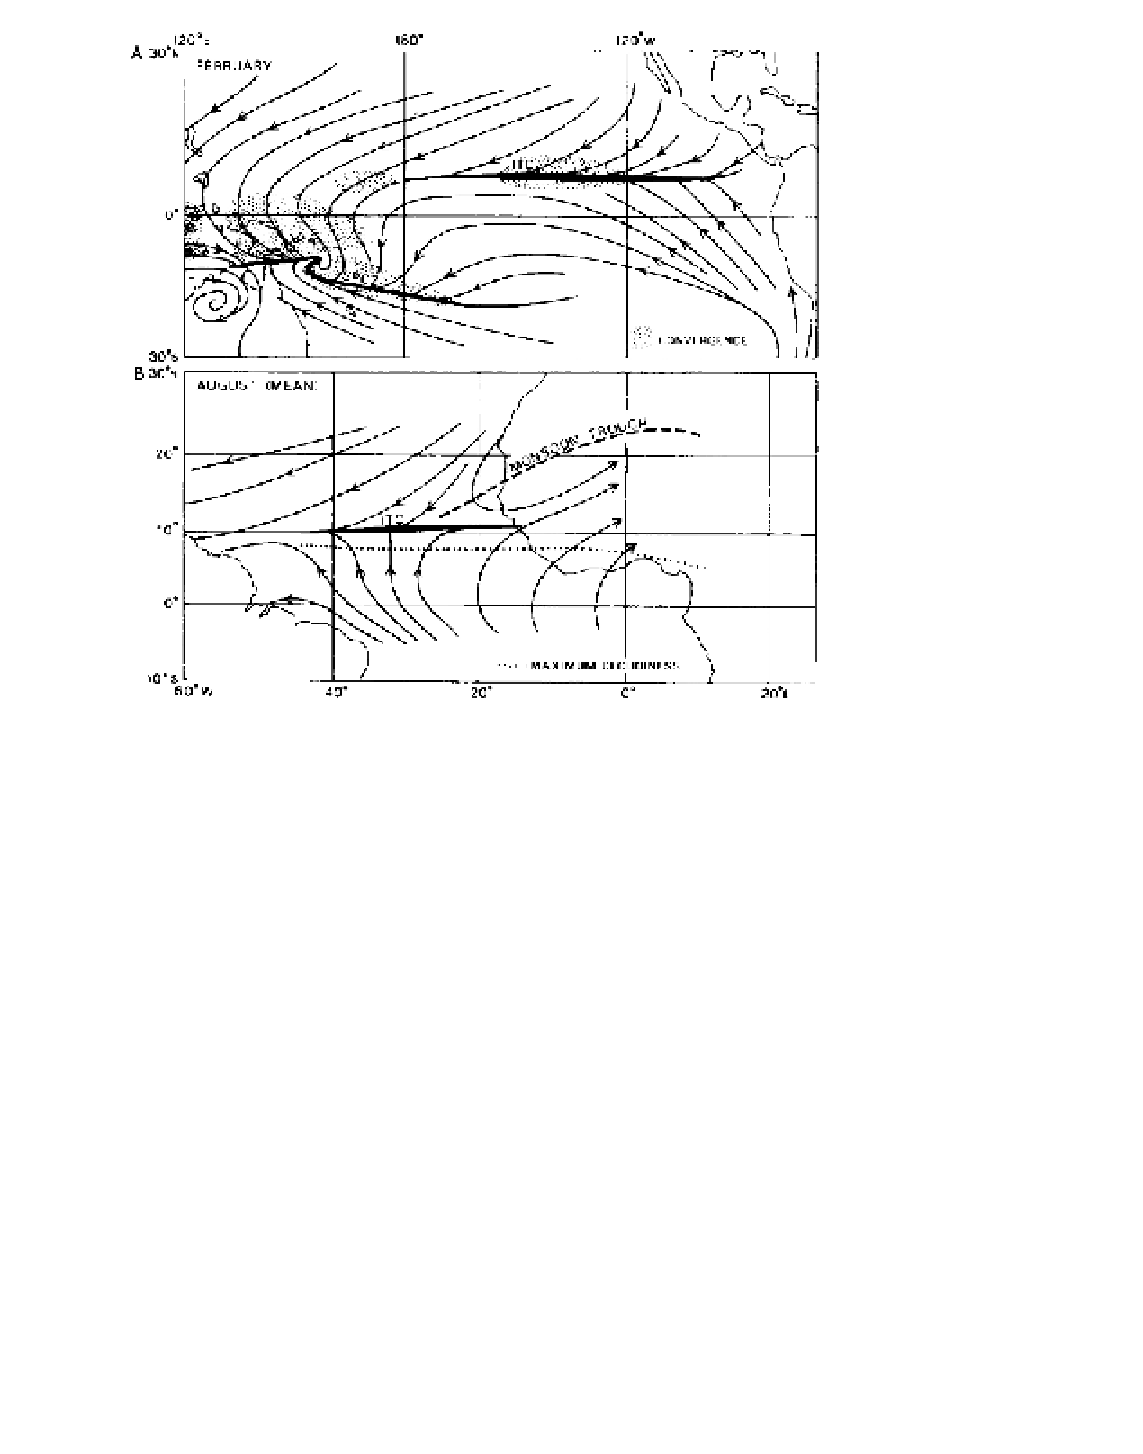
Figure 11.2
Illustrations of (A)
streamline convergence forming
an intertropical convergence (ITC)
and South Pacific convergence zone
(SPCZ) in February, and (B) the
contrasting patterns of monsoon
trough over West Africa, streamline
convergence over the central tropical
North Atlantic, and axis of maximum
cloudiness to the south for August.
Sources
: (A) C. S. Ramage, personal
communication (1986). (B) From Sadler
(1975a).
thermal equator (zone of seasonal maximum temper-
ature). The location of the thermal equator is related
directly to solar heating (see Figures 11.2 and 3.11), and
there is an obvious link between this and the equatorial
trough in terms of thermal lows. However, if the ITC
were to coincide with the equatorial trough then this
zone of cloudiness would decrease incoming solar
radiation, reducing the surface heating needed to
maintain the low-pressure trough. In fact, this does not
happen. Solar energy is available to heat the surface
because the maximum surface wind convergence, uplift
and cloud cover is commonly located several degrees
equatorward of the trough. In the Atlantic (Figure
11.2B), for example, the cloudiness maximum is distinct
from the equatorial trough in August. Figure 11.2
illustrates regional differences in the equatorial trough
and ITCZ. Convergence of two trade wind systems
occurs over the central North Atlantic in August and
the eastern North Pacific in February. In contrast, the
equatorial trough is defined by easterlies on its poleward
side and westerlies on its equatorward side over West
Africa in August and over New Guinea in February.
The dynamics of low-latitude atmosphere-ocean
circulations are also involved. The convergence zone in
the central equatorial Pacific moves seasonally between
about 4°N in March to April and 8°N in September,
giving a single pronounced rainfall maximum in March
to April. This appears to be a response to the relative
strengths of the northeast and southeast trades. The
ratio of South Pacific/North Pacific trade wind strength
exceeds 2 in September but falls to 0.6 in April.
Interestingly, the ratio varies in phase with the ratio of
Antarctic-Arctic sea ice areas; Antarctic ice is at a maxi-
mum in September when Arctic ice is at its minimum.
The convergence axis is often aligned close to the
zone of maximum sea-surface temperatures, but is not
anchored to it. Indeed, the SST maximum located within
the equatorial counter-current (see Figure 7.29) is a
result of the interactions between the trade winds and
horizontal and vertical motions in the ocean-surface
layer.
Aircraft studies show the complex structure of the
central Pacific ITCZ. When moderately strong trades
provide horizontal moisture convergence, convective
cloud bands form, but the convergent lifting may be
insufficient for rainfall in the absence of upper-level
divergence. Moreover, although the southeast trades
cross the equator, the mean monthly resultant winds