Geoscience Reference
In-Depth Information
climatic type, based on the more reliable data for the
semi-arid margins of the subtropical cells.
Observations at Tucson (730 m), Arizona, between
1895 and 1957 showed a mean annual precipitation of
277 mm falling on an average of about forty-five days
per year, with extreme annual figures of 614 mm and
145 mm. Two moister periods in late November to
March (receiving 30 per cent of the mean annual
precipitation) and late June to September (50 per cent)
are separated by more arid seasons from April to June
(8 per cent) and October to November (12 per cent). The
winter rains are generally prolonged and of low intensity
(more than half the falls have an intensity of less than 5
mm per hour), falling from altostratus clouds associated
with the cold fronts of depressions that are forced to
take southerly routes by strong blocking to the north.
This occurs during phases of equatorial displacement
of the Pacific subtropical high-pressure cell. The re-
establishment of the cell in spring, before the main
period of intense surface heating and convectional
showers, is associated with the most persistent drought
episodes. Dry westerly to southwesterly flow from the
eastern edge of the Pacific subtropical anticyclone is
responsible for the low rainfall in this season. During
one twenty-nine-year period in Tucson, there were
eight spells of more than 100 consecutive days of
complete drought and twenty-four periods of more than
seventy days. The dry conditions occasionally lead to
dust storms. Yuma records nine per year, on average,
associated with winds averaging 10-15 m s
-1
. They
occur both with cyclonic systems in the cool season and
with summer convective activity. Phoenix experiences
six to seven per year, mainly in summer, with visibility
reduced below 1 km in nearly half of these events.
The period of summer precipitation (known in
Arizona as the summer 'monsoon') is quite sharply
defined. The southerly airflow regime at the surface and
700 mb (see Figures 7.4 and 7.9) often sets in abruptly
around 1 July and is therefore recognized as a singu-
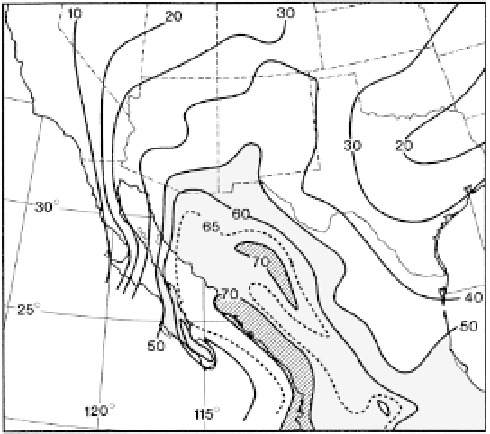
larity. Figure 10.24 shows that southeastern Arizona
and southwestern New Mexico receive over 50 per
cent of their annual rainfall during July to September.
Further south over the Sierra Madre Occidentale and
the southern coast of the Gulf of California, this figure
exceeds 70 per cent. The American southwest forms
only the northern part of the area of the Mexican or
North American monsoon.
Precipitation occurs mainly from convective cells
initiated by surface heating, convergence or, less
commonly, orographic lifting when the atmosphere is
destabilized by upper-level troughs in the westerlies.
These summer convective storms form in mesoscale
clusters, the individual storm cells together covering
less than 3 per cent of the surface area at any one time,
and persisting for less than an hour on average. The
storm clusters move across the country in the direction
of the upper-air motion. Often their motion seems to be
controlled by low-level jet streams. The airflow
associated with these storms is generally southerly along
the southern and western margins of the Atlantic (or
Bermudan) subtropical high. The moisture at low levels
in southern Arizona is derived mainly from the Gulf of
California during 'surges' associated with the south-
southwesterly low-level Sonoran jet (850 to 700 mb).
Moisture from the Gulf of Mexico reaches higher
elevations in Arizona-New Mexico with southeasterly
flows at 700 mb.
Precipitation from these convective cells is extremely
local (see Plate 11), and is commonly concentrated
in the mid-afternoon and evening. Intensities are
much higher than in winter, half the summer rain
falling at more than 10 mm per hour. During a twenty-
nine-year period, about a quarter of the mean annual
precipitation fell in storms giving 25 mm rain or more
per day. These intensities are much less than those
Figure 10.24
The contribution (per cent) of JAS precipitation to
the annual total in the southwestern United States and northern
Mexico. Area greater than 50 per cent tinted and greater than 70
per cent hatched.
Source
: After M.W. Douglas
et al
. (1993, p.1667, fig. 3). Courtesy of
the American Meteorological Society.