Geoscience Reference
In-Depth Information
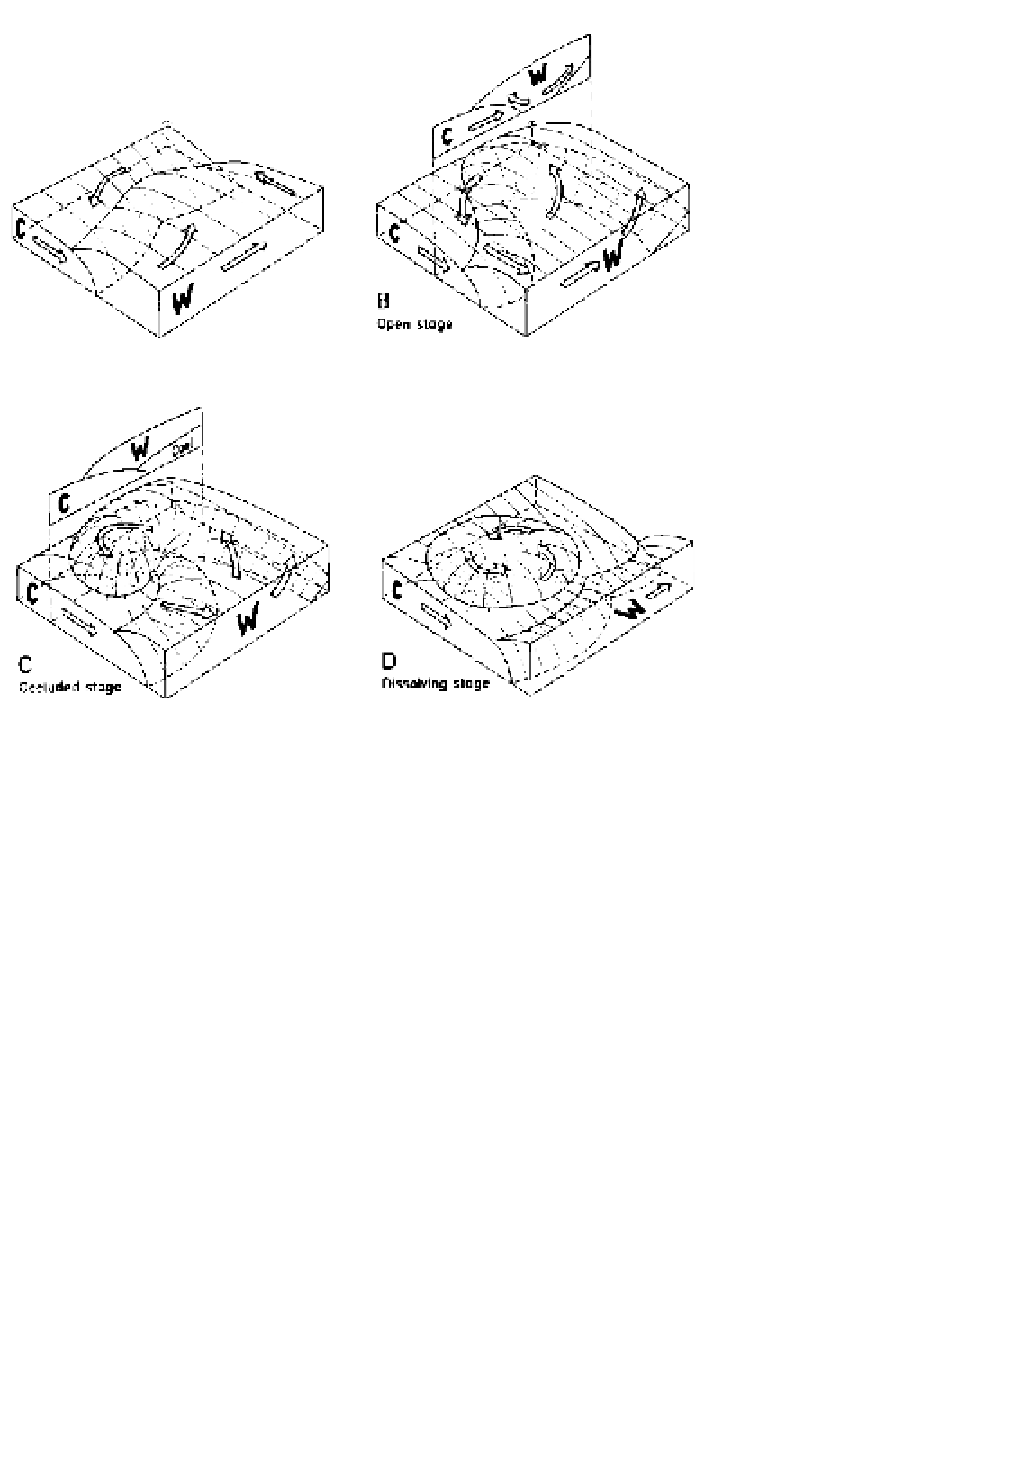
Figure 9.7
Four stages in the typical
development of a mid-latitude depres-
sion. Satellite views of the cloud
systems corresponding to these stages
are shown in Figure 9.8.
Notes
: C = cold air; W = warm air.
Source
: Mostly after Strahler (1965),
modified after Beckinsale.
A
Early stage
B
Open stage
C
Occluded stage
D
Dissolving stage
airmasses. According to the 'Norwegian cyclone model'
(see Figure 9.7), the interface between these airmasses
develops into a wave form with its apex located at the
centre of the low-pressure area. The wave encloses a
mass of warm air between modified cold air in front and
fresh cold air in the rear. The formation of the wave also
creates a distinction between the two sections of the
original airmass discontinuity for, although each section
still marks the boundary between cold and warm air, the
weather characteristics found within each section are
very different. The two sections of the frontal surface
are distinguished by the names
warm front
for the
leading edge of the wave and the warm air and
cold front
for that of the cold air to the rear (see Figure 9.7B).
The boundary between two adjacent airmasses is
marked by a strongly baroclinic zone of large temper-
ature gradient, 100 to 200 km wide (see C, this chapter,
and Figure 9.1). Sharp discontinuities of temperature,
moisture and wind properties at fronts, especially the
warm front, are rather uncommon. Such discontinuities
are usually the result of a pronounced surge of fresh,
cold air in the rear sector of a depression, but in the
middle and upper troposphere they are often caused by
subsidence and may not coincide with the location of
the baroclinic zone. In meteorological analysis centres,
numerous criteria are used to locate frontal boundaries:
1000 to 500-mb thickness gradients, 850-mb wet-bulb
potential temperature, cloud and precipitation bands,
and wind shifts. However, a forecaster may have to use
judgement when some of these criteria disagree.
On satellite imagery, active cold fronts in a strong
baroclinic zone commonly show marked spiral cloud
bands, formed as a result of the thermal advection
(Figure 9.8B, C). A cirrus shield, however, typically
covers warm fronts. As Figure 9.23 shows, an upper
tropospheric jet stream is closely associated with the
baroclinic zone, blowing roughly parallel to the line
of the upper front (see Plate 17). This relationship is
examined below.
Air behind the cold front, away from the low centre,
commonly has an anticyclonic trajectory and hence
moves at a greater than geostrophic speed (see Chapter
6A.4), impelling the cold front to acquire a super-
geostrophic speed also. The wedge of warm air is
pinched out at the surface and lifted bodily off the
ground. This stage of
occlusion
eliminates the wave
form at the surface (see Figure 9.7). The depression
usually achieves its maximum intensity twelve to