Geoscience Reference
In-Depth Information
world's major wind belts, shown by the maps in Figure
7.12. In the northern hemisphere, the pressure gradients
surrounding these cells are strongest between October
and April. In terms of actual pressure, however, oceanic
cells experience their highest pressure in summer, the
belt being counterbalanced at low levels by thermal low-
pressure conditions over the continents. Their strength
and persistence clearly mark them as the dominating
factor controlling the position and activities both of the
trades and the westerlies.
1 The trade winds
The trades (or tropical easterlies) are important because
of their great extent, affecting almost half the globe
(see Figure 7.13). They originate at low latitudes on
the margins of the subtropical high-pressure cells,
and their constancy of direction and speed (about 7 m
s
-1
) is remarkable. Trade winds, like the westerlies, are
strongest during the winter half-year, which suggests
they are both controlled by the same fundamental
mechanism.
The two trade wind systems tend to converge in the
equatorial trough
(of low pressure). Over the oceans,
particularly the central Pacific, the convergence of
these airstreams is often pronounced and in this sector
the term
intertropical convergence zone
(ITCZ) is
applicable. Generally, however, the convergence is dis-
continuous in space and time (see Plate 24). Equatorward
of the main belts of the trades over the eastern Pacific
and eastern Atlantic are regions of light, variable
winds, known traditionally as the
doldrums
and much
feared in past centuries by the crews of sailing ships.
Their seasonal extent varies considerably: from July to
September they spread westward into the central Pacific
while in the Atlantic they extend to the coast of Brazil.
A third major doldrum zone is located in the Indian
Ocean and western Pacific. In March to April it stretches
16,000 km from East Africa to 180° longitude and is
again very extensive during October to December.
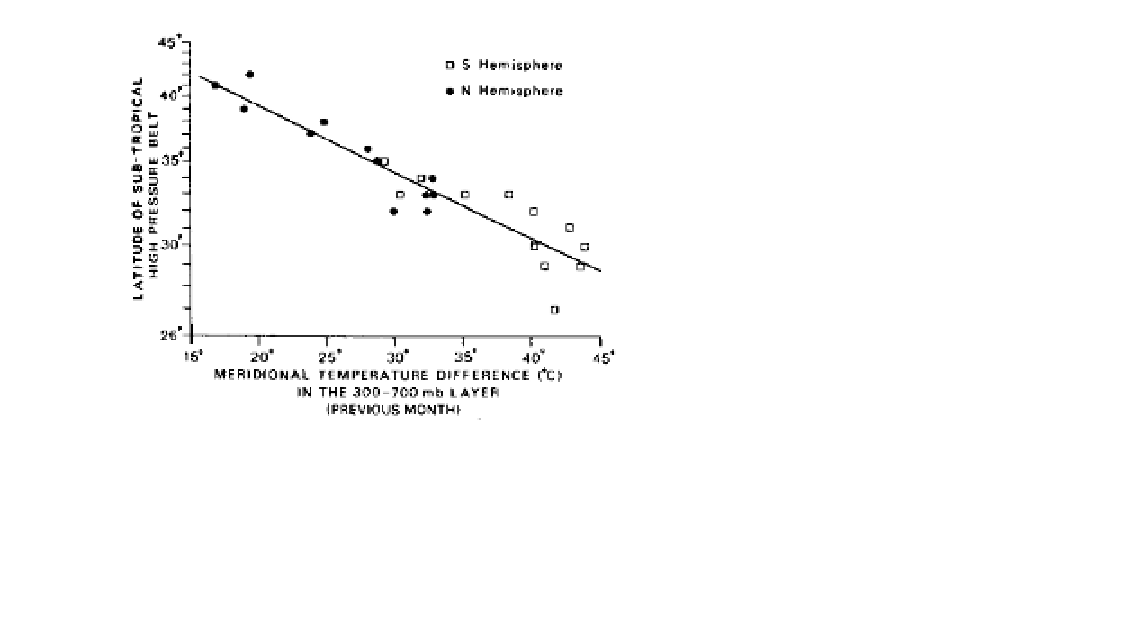
Figure 7.11
A plot of the meridional temperature difference at
the 300 to 700-mb level in the previous month against the latitude
of the centre of the subtropical high-pressure belt, assuming a
constant vertical tropospheric lapse rate.
Source
: After Flohn, in
Proceedings of the World Climate Conference
,
WMO N0.537 (1979, p. 257, Fig. 2).
mean monthly pressure maps represent the passage
of deep depressions across these areas downstream of
the upper long-wave troughs. The mean high-pressure
areas, however, represent more or less permanent highs.
The intermediate zones located about 50 to 55°N and
40 to 60°S are affected by travelling depressions and
ridges of high pressure; they appear on the mean maps
as being of neither markedly high nor markedly low
pressure. The movement of depressions is considered
in Chapter 9F.
On comparing the surface and tropospheric pressure
distributions for January (see Figures 7.3, 7.4 and 7.9,
7.10), it is apparent that only the subtropical high-
pressure cells extend to high levels. The reasons for this
are evident from Figures 7.1B and D. In summer, the
equatorial low-pressure belt is also present aloft over
South Asia. The subtropical cells are still discernible
at 300 mb, showing them to be a fundamental feature
of the global circulation and not merely a response to
surface conditions.
2 The equatorial westerlies
B THE GLOBAL WIND BELTS
In the summer hemisphere, and over continental areas
especially, there is a narrow zone of generally westerly
winds intervening between the two trade wind belts
(Figures 7.12 and 7.14). This westerly system is well
marked over Africa and South Asia in the northern
hemisphere summer, when thermal heating over the
The importance of the subtropical high-pressure cells is
evident from the above discussion. Dynamic, rather than
immediately thermal, in origin, and situated between
20° and 30° latitude, they seem to provide the key to the