Geoscience Reference
In-Depth Information
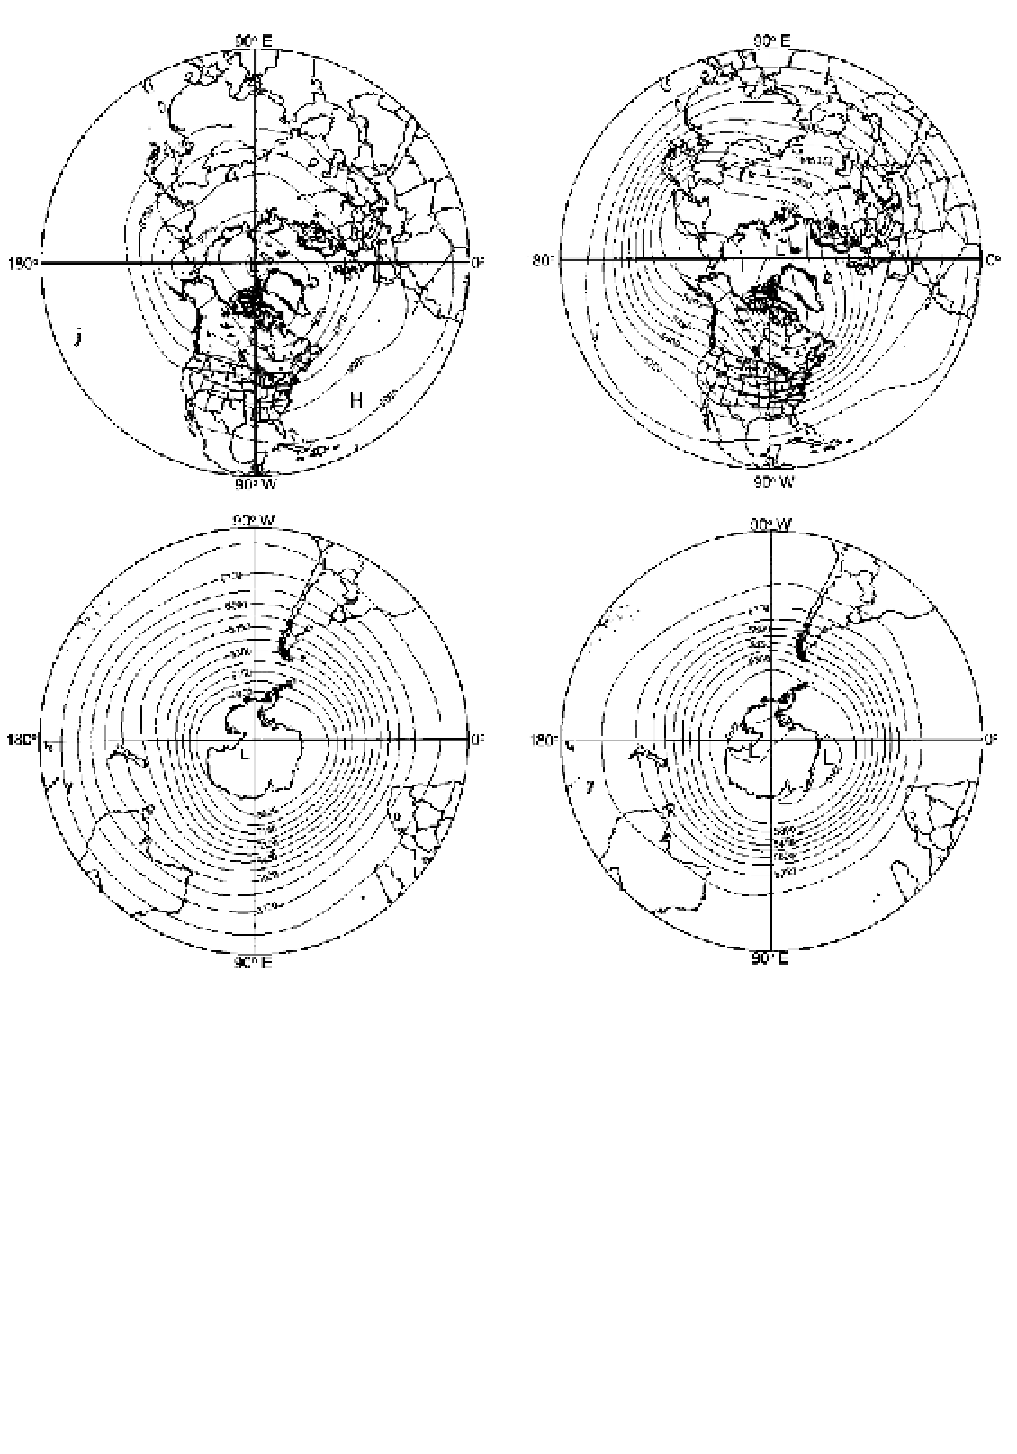
Figure 7.3
The mean contours (gpm) of the 500-mb pressure
surface in July for the northern and southern hemispheres, 1970
to 1999.
Source
: NCEP/NCAR Reanalysis Data from the NOAA-CIRES
Climate Diagnostics Center.
Figure 7.4
The mean contours (gpm) of the 500-mb pressure
surface in January for the northern and southern hemispheres,
1970 to 1999.
Source
: NCEP/NCAR Reanalysis Data from the NOAA-CIRES
Climate Diagnostics Center.
cyclonic vortex poleward of latitude 30°S in summer
and winter. The vortex is more or less symmetrical
about the pole, although the low centre is towards the
Ross Sea sector. Corresponding charts for the northern
hemisphere also show an extensive cyclonic vortex, but
one that is markedly more asymmetric with a primary
centre over the eastern Canadian Arctic and a secondary
one over eastern Siberia. The major troughs and ridges
form what are referred to as
long waves
(or
Rossby
waves
) in the upper flow. It is worth considering why
the hemispheric westerlies show such large-scale
waves. The key to this problem lies in the rotation of
the earth and the latitudinal variation of the Coriolis
parameter (Chapter 6A.2). It can be shown that for
large-scale motion the absolute vorticity about a vertical
axis (
f
ζ) tends to be conserved, i.e.
d (
f
ζ) d
t
= 0