Geoscience Reference
In-Depth Information
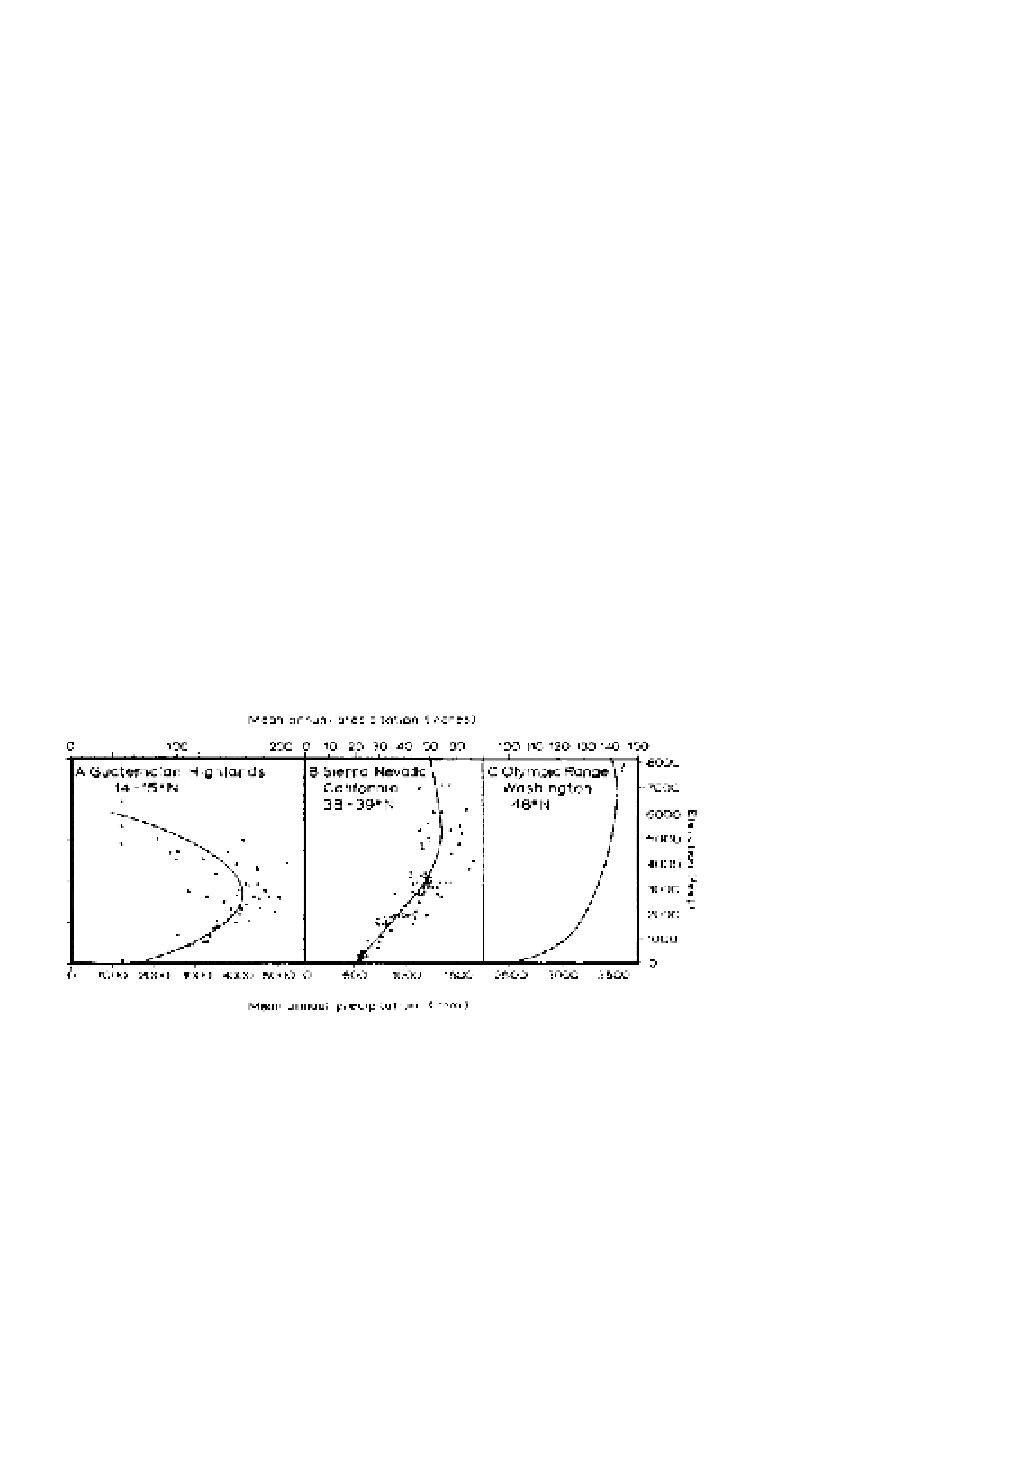
coast, the occurrence of a precipitation maximum below
the mountain crest is observed in the Sierra Nevada,
despite some complication introduced by the shielding
effect of the Coast Ranges (Figure 4.18B), but in the
Olympic Mountains of Washington precipitation
increases right up to the summits. Precipitation gauges
on mountain crests may underestimate the actual precip-
itation due to the effect of eddies, and this is particularly
true where much of the precipitation falls in the form
of snow, which is very susceptible to blowing by the
wind.
One explanation of the orographic difference
between tropical and temperate rainfall is based on
the concentration of moisture in a fairly shallow layer
of air near the surface in the tropics (see Chapter 11).
Much of the orographic precipitation seems to derive
from warm clouds (particularly cumulus congestus),
composed of water droplets, which commonly have an
upper limit at about 3000 m. It is probable that the height
of the maximum precipitation zone is close to the
mean cloud base, since the maximum size and number
of falling drops will occur at that level. Thus, stations
located above the level of mean cloud base will receive
only a proportion of the orographic increment. In tem-
perate latitudes, much of the precipitation, especially in
winter, falls from stratiform cloud, which commonly
extends through a considerable depth of the troposphere.
In this case, there tends to be a smaller fraction of the
total cloud depth below the station level. These differ-
ences according to cloud type and depth are apparent
even on a day-to-day basis in mid-latitudes. Seasonal
variations in the altitude of the mean condensation
level and zone of maximum precipitation are similarly
observed. In the Pamir and Tien Shan of Central Asia.
for instance, the maximum is reported to occur at about
1500 m in winter and at 3000 m or more in summer.
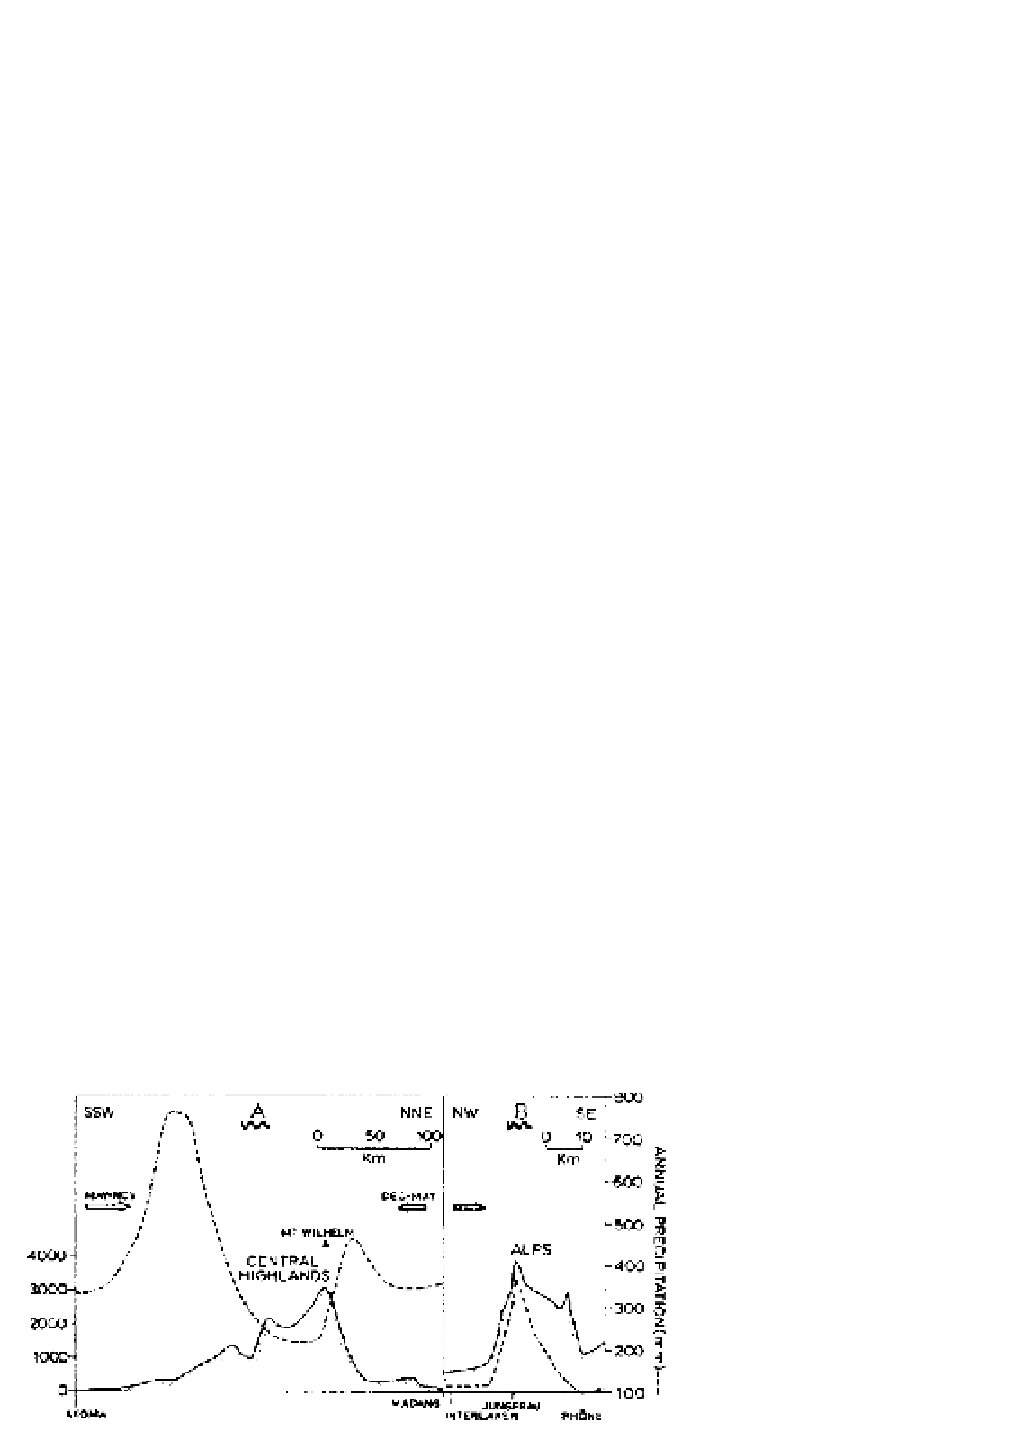
A further difference between orographic effects on
precipitation in the tropics and the mid-latitudes relates
to the high instability of many tropical airmasses. Where
mountains obstruct the flow of moist tropical airmasses,
the upwind turbulence may be sufficient to trigger
convection, producing a rainfall maximum at low
elevations. This is illustrated in Figure 4.19A for Papua
New Guinea, where there is a seasonally alternating
Figure 4.18
Generalized curves
showing the relationship between
elevation and mean annual precipi-
tation for west-facing mountain slopes
in Central and North America. The
dots give some indication of the wide
scatter of individual precipitation
readings.
Source
: Adapted from Hastenrath (1967),
and Armstrong and Stidd (1967).
Mean annual precipitation (inches)
0
100
200 0 10 20 30 40 50 60
100110120130140150
2500
8000
7000
6000
5000
4000
3000
2000
1000
0
A Guatemalan Highlands
B Sierra Nevada
California
38-39˚N
C Olympic Range
Washington
48˚N
?
14-15˚N
2000
1500
1000
500
0
0
1000 2000 3000 4000 5000 0
500
1000
1500
2500
3000
3500
Mean annual precipitation (mm)
Figure 4.19
The relationship between
precipitation (broken line) and relief in the
tropics and mid-latitudes. (A) The highly
saturated airmasses over the Central
Highlands of Papua New Guinea give
seasonal maximum precipitations on the
windward slopes of the mountains with
changes in the monsoonal circulation; (B)
Across the Jungfrau massif in the Swiss
Alps the precipitation is much less than in
(A) and is closely correlated with the
topography on the windward side of the
mountains. The arrows show the
prevailing airflow directions.
Sources
: (A) After Barry 1991); (B) After
Maurer and Lütschg (from Barry).
800
SSW
A
NNE NW
B
SE
0
50
100
0
10
Km
700
Km
600
MAY-NOV
DEC-MAY
500
MT WILHELM
ALPS
4000
3000
2000
1000
0
CENTRAL
HIGHLANDS
400
300
200
100
MADANG
JUNGFRAU
AKOMA
INTERLAKEN
RHôNE