Geoscience Reference
In-Depth Information
from rocket flights and satellite sounding systems.
There are three relatively warm layers (near the
surface; between 50 and 60km; and above about
120km) separated by two relatively cold layers
(between 10 and 30km; and 80-100km). Mean
January and July temperature sections illustrate
the considerable latitudinal variations and
seasonal trends that complicate the scheme (see
Figure 2.15
).
Temperature (°F)
-4
0
-20
0
20
40
60
80
100
50
(A)
40
30
20
10
1 Troposphere
The lowest layer of the atmosphere is called the
troposphere. It is the zone where weather
phenomena and atmospheric turbulence are most
marked, and it contains 75 percent of the total
molecular or gaseous mass of the atmosphere
and virtually all the water vapor and aerosols.
Throughout this layer, there is a general decrease
of temperature with height at a mean rate of about
6.5°C/km. The decrease occurs because air is
compressible and its density decreases with height,
allowing rising air to expand and thereby cool. In
addition, turbulent heat transfer from the surface
mainly heats the lower atmosphere, not direct
absorption of radiation. The troposphere is
capped in most places by a temperature inversion
level (i.e., a layer of relatively warm air above a
colder layer) and in others by a zone that is
isothermal with height. The troposphere thus
remains to a large extent self-contained, because
the inversion acts as a 'lid' that effectively limits
convection (see Chapter 4E). This inversion level
or weather ceiling is called the
tropopause
(see
Note 5 and
Box 2.2
). Its height is not constant in
either space or time. It seems that the height of the
tropopause at any point is correlated with sea-
level temperature and pressure, which are in turn
related to the factors of latitude, season and daily
changes in surface pressure. There are marked
variations in the altitude of the tropopause
with latitude (
Figure 2.16
), from about 16km at
the equator, where there is strong heating and
vertical convective turbulence, to only 8km at
the poles.
0
50
(B)
20
10
5
5
2
1
0.5
0.5
0.2
0.1
-40
-20 0
Temperature (°C)
20
40
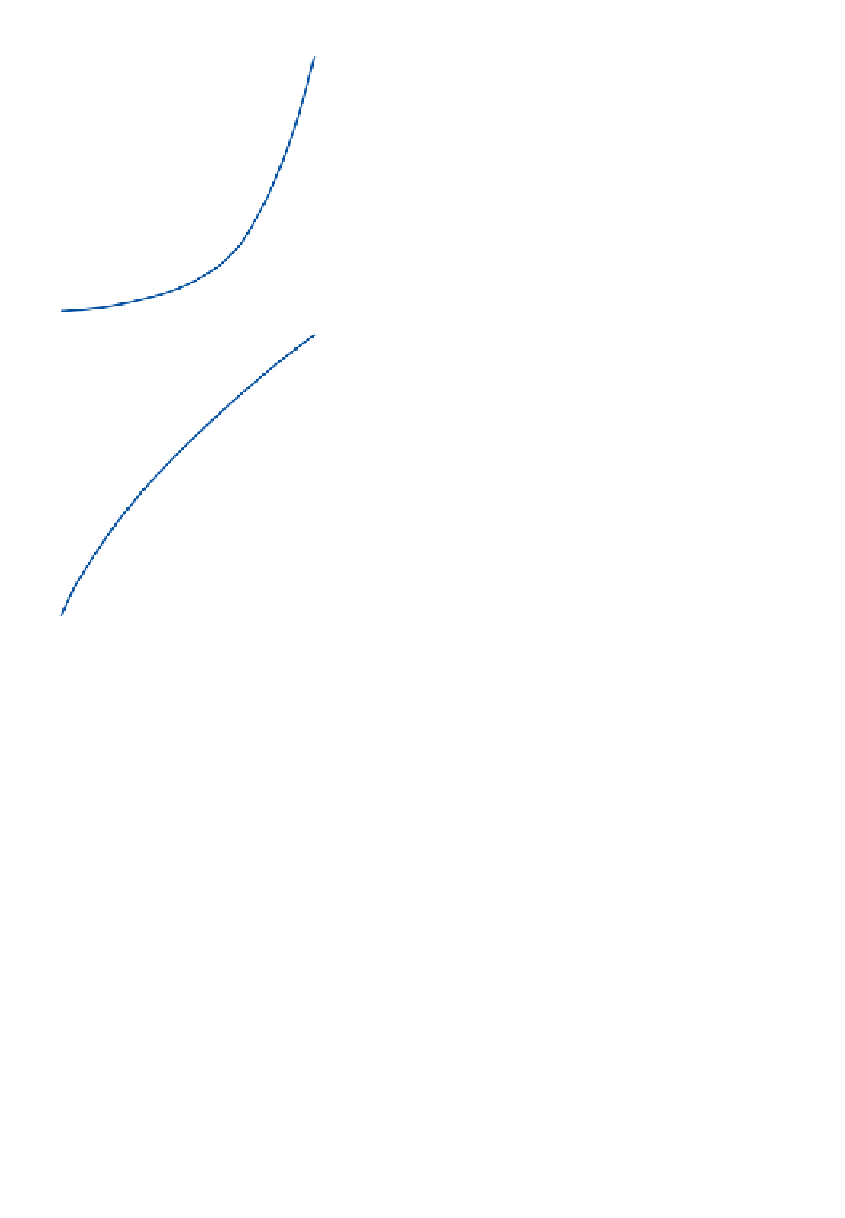
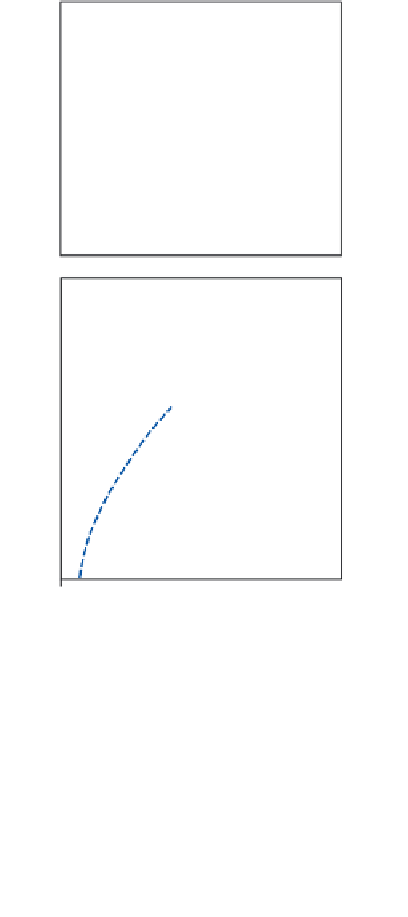
Figure 2.14
Plots of saturation vapor pressure as
a function of temperature (i.e., the dew-point
curve). A The semi-logarithmic plot. B shows that
below 0°C the atmospheric saturation vapor
pressure is less with respect to an ice surface than
with respect to a water drop. Thus, condensation
may take place on an ice crystal at lower air
humidity than is necessary for the growth of water
drops.
C THE LAYERING OF THE
ATMOSPHERE
The atmosphere can be divided conveniently into
a number of rather well-marked horizontal layers,
mainly on the basis of temperature (
Figure 2.15
).
The evidence for this structure comes from regular
rawinsonde (radar wind-sounding) balloons,
radio wave investigations, and, more recently,