Geoscience Reference
In-Depth Information
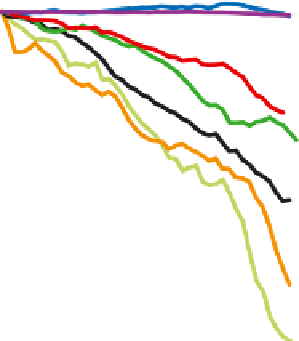
Figure 13.22
Cumulative mean specific mass balance (A) and cumulative total mass balance (B) of
glaciers and ice caps calculated for large regions, based on the analysis of Dyurgerov and Meier (2005).
Mean specific mass balance shows the strength of climate change in the particular regions. Total mass
balance is the contribution from each region to sea-level rise.
Source: IPCC (2007). Reproduced by permission of the IPCC (ch. 4, Observations: Changes in snow, ice and frozen ground, Report
of WG1 1, IPCC, p. 359, fig. 4.15).
advancing glaciers but the overall picture is clear.
Projections for the year 2050 suggest that a quarter
of the world's present glacier mass may disappear
with critical and irreversible long-term conse-
quences for water resources in alpine countries.
Another clear indicator of climate change is the
Arctic Ocean's shrinking sea ice (plates 13.4 and
13.5). Over the modern satellite record, which
begins in 1979, ice extent shows significant
downward trends in all months, but largest in
September (the end of the melt season) at about
10 percent per decade. The pace of summer ice
loss appears to have accelerated since the turn of
the twenty-first century
.
Figure 13.23
plots
observed Arctic sea ice extent for September over
an extended record spanning the years 1953
through 2006, along with simulated extent for the
period 1900 through 2100 from a suite of the
IPCC models. The simulations employ observed
radiative forcings through the twentieth century
and the A1B emissions scenario for the twenty-
first century. Essentially all models indicate
that sea ice extent should be declining over the
period of observations. This consensus is strong
evidence for a role of greenhouse gas loading on
the observed decline. However, none of the
simulations over the period 1953-2006 yield a
downward trend as large as is observed. One
explanation is that natural variability in the
observed coupled system has been a very strong
player. Changes in cloud cover, wind-driven
alterations in sea ice circulation and ice thickness
associated with the North Atlantic Oscillation
and other patters of atmospheric variability and
altered ocean heat transport have all been
implicated in the observed retreat. The alternative
explanation is that the IPCC models as a group
under-represent the sensitivity of the sea ice cover