Geoscience Reference
In-Depth Information
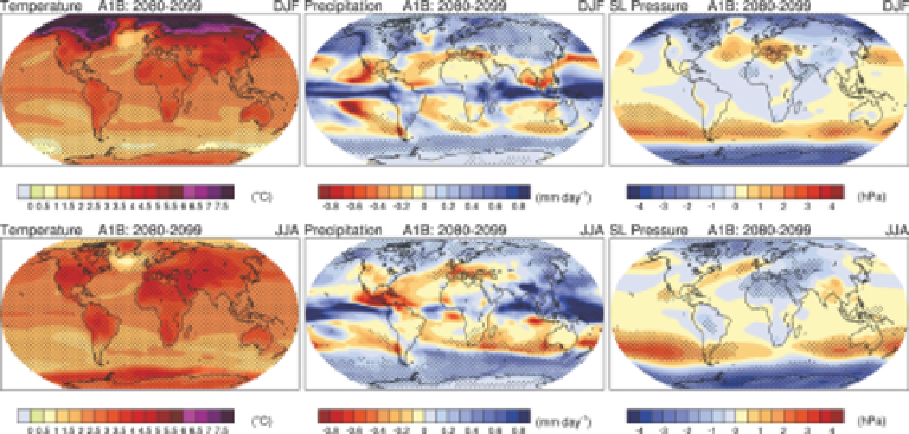
some of this complexity,
Figure 13.19
summarizes
projected changes in air temperature, precipita-
tion and sea-level pressure for the 20-year period
2080-2099, relative to 1980-1999, for the A1B
emissions scenario. Results are given for both
winter and summer. The pattern is complex.
Precipitation is expected to increase in high
latitudes and along the ITCZ (pointing to stronger
moisture flux convergence) while it will decrease
over most subtropical land regions and surround-
ing oceans. Sea-level pressure is expected to fall in
the high latitudes, with compensating increases in
parts of the mid-latitudes and subtropics where
precipitation amounts are expected to decline.
This follows as high pressure at the surface tends
to be accompanied by descending air motion
and low-level divergence unfavorable to con-
densation.
The overall picture of evolving conditions
through the twenty-first century, based on the
IPCC models and results from other studies,
includes:
F PROJECTED CHANGE IN
OTHER SYSTEM COMPONENTS
1 Hydrologic cycle and
atmospheric circulation
Anticipated changes in the hydrologic cycle
through the twenty-first century must consider
complex interactions between rises in surface and
tropospheric temperature that affect evaporation
rates and the vapor-holding capacity of the
atmosphere, changes in precipitation phase (snow
versus rain), changes in patterns of atmospheric
convection and shifts in circulation from the
synoptic to global scale. Given anticipated changes
in the vertical temperature structure (with
warming of the earth's surface and troposphere
accompanied by cooling of the stratosphere, as a
result of the process of attaining radiative
equilibrium) and the strong horizontal asym-
metry in warming patterns such as shown in
Figure 13.18
, shifts in atmospheric circulation
should come as no surprise. As an illustration of
Figure 13.19
Projected changes in surface air temperature, precipitation and sea-level pressure, relative to the
base period 1980-1999, for the 20-year period 2080-2099. Results are given for both winter and summer using the
A1B emissions scenario, based on global climate models participating in the IPCC Fourth Assessment Report. The
maps represent the multi-model average.
Source:IPCC (2007). Reproduced by permission of the IPCC (ch. 10, Global climate projections, Report of WG1 1, IPCC, p. 767, fig. 10.9).