Geoscience Reference
In-Depth Information
60
60
(A)
(B)
50
50
40
Winter (Dec-Feb)
40
30
30
20
20
10
10
s
Summer (June-Aug)
0
0
J
FM
A
M
J J
Month
A
S
O
N
D 00
04
08
12
16
20
24
Hour
0.20
0.16
(C)
(D)
NO
2
0.16
0.12
Los Angeles
O
3
0.12
0.08
0.08
0.04
NO
Denver
0.04
0.00
J
FM
A
M
J J
Month
A
S
O
N
D 00
04
08
12
16
20
24
Hour
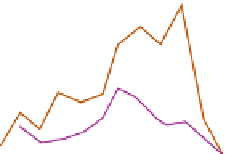
Figure 12.19
Annual and daily pollution cycles. A: Annual cycle of smoke pollution in and around
Leicester, England, during the period 1937-1939, before smoke abatement legislation was introduced. B:
Diurnal cycle of smoke pollution in Leicester during summer and winter, 1937-1939. C: Annual cycle of
mean daily maximum one-hour average oxidant concentrations for Los Angeles (1964-1965) and Denver
(1965) (dashed). D: Diurnal cycles of nitric oxide (NO), nitrogen dioxide (NO
2
) and ozone (O
3
) concentrations
in Los Angeles on 19 July 1965.
Sources: A, B: After Meetham (1952) [et al. 1980]. C, D: After US DHEW (1970) and Oke (1978).
very stable atmospheric conditions combine with
excessive pollution production to give dense
smog of a lethal character. During the period 5-9
December 1952, a temperature inversion over
London caused a dense fog with visibility of
less than 10 m for 48 consecutive hours. There
were 12,000 more deaths (mainly from chest
complaints) during the period December 1952 to
February 1953 compared with the same period the
previous year. The close association of the
incidence of fog with increasing industrialization
and urbanization was well shown by the city
of Prague, where the mean annual number of
days with fog rose from 79 during the period
1860-1880 to 217 during 1900-1920.
The use of smokeless fuels and other pollution
controls cut London's total smoke emission from
10
8
kg
(89,000 tons) in 1960.
Figure 12.20B
shows the
increase in average monthly sunshine figures for
1958-1967 compared with those of 1931-1960.
Since the early 1960s annual average concentra-
tions of smoke and sulfur dioxide in the UK have
fallen from 160ppm and 60ppm, respectively, to
below 20ppm and 10ppm in the 1990s.
Visibility in the UK improved at many
measuring sites during the second half of the
twentieth century. In the 1950s-1960s, days with
visibility at midday in the lowest 10th percentile
were generally in the 4-5km range, whereas in
the 1990s this had improved to 6-9km. Annual
average 12 UTC visibility at Manchester airport
was 10km in 1950, but near 30km in 1997. The
improvements are attributed to improved fuel
10
8
kg (141,000 tons) in 1952 to 0.9
1.4
×
×