Geoscience Reference
In-Depth Information
80°W
70°
60°
50°
40°
300
200
100
0
0
km
1000
Caracas
10°N
0
miles
500
Georgetown
J
D
400
A
300
Bogota
200
100
300
200
0
J
D
200
100
0
J
100
0
J
D
Qu
i
to
D
200
100
0
J
0°
Belém
Mana
u
s
D
200
100
0
J
200
100
0
J
10°S
100
0
J
D
Lima
D
MATO GROSSO
D
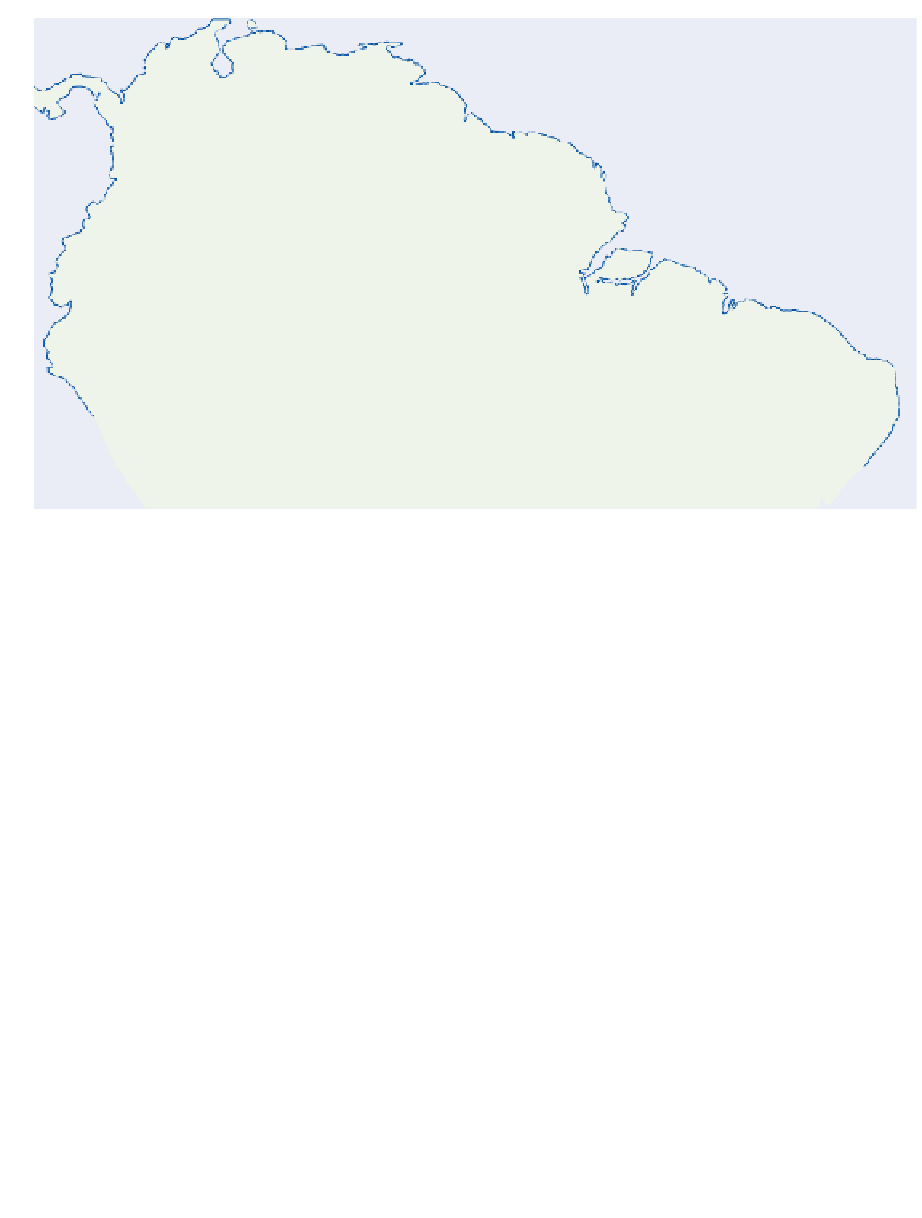
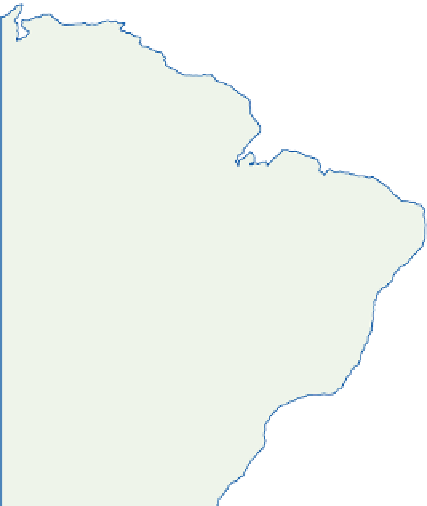
Figure 11.46
Mean annual precipitation (mm) over the Amazon basin, together with mean monthly precipitation
amounts for eight stations.
Source: From Ratisbona (1976). By permission of Elsevier Science NL.
Figure 11.47
The synoptic elements of Brazil.
The seasonal positions of the coastal Intertropical
Convergence Zone; the maximum northerly exten-
sion of cool southerly mP air masses; and the
positions of a typical frontal system during six
successive days in November as the center of the
low pressure moves southeastward into the South
Atlantic.
Source: From Ratisbona (1976). By permission of Elsevier
Science NL.
70°W
60°
50°
40°
10°N
10°N
0°
0°
3
2
10°
F AMAZONIA
Amazonia lies athwart the equator (
Figure 11.48
)
and contains some 30 percent of the total global
biomass. The continuously high temperatures
(24-28
10°
6
6
4
5
5
1
20°S
C) combine with the high transpiration to
cause the region to behave at times as if it were a
source of maritime equatorial air.
Important influences over the climate of
Amazonia are the North and South Atlantic
subtropical high pressure cells. From these, stable
easterly mT air invades Amazonia in a shallow
°
ITCZ
Maximum north
extension of
cool air masses
1-6 daily positions
of November
frontal system
20°S
4
2
1
3
70°W
60°
50°
40°