Geoscience Reference
In-Depth Information
%
VALENTIA
%
WICK
%
MANCHESTER
%
LONDON
%
ALBORG
20
20
20
20
20
15
15
15
15
15
10
10
10
10
10
5
5
5
5
5
0
0
0
0
0
0
5
10
15 20 ms
-1
0
5
10
15 20 ms
-1
0
5
10
15 ms
-1
0
5
10
15ms
-1
0
5
10
15 20 ms
-1
%
ORLEANS
20
%
FRANKFURT
15
20
10
15
5
10
0
0
5
10
15ms
-1
5
BORDEAUX
%
0
20
0
5
10
15 ms
-1
MILAN
15
%
30
10
25
5
20
0
15ms
-1
0
5
10
15
%
MADRID
10
20
5
20
0
15
15 ms
-1
0
5
10
10
%
BRINDISI
15
5
10
0
500
0
15 ms
-1
0
5
10
km
5
0
%
LISBON
15 20 ms
-1
0
5
10
20
m s
-1
Sheltered
Open
Coast
Sea
Hills
15
>6.0
5.0 - 6.0
4.5 - 5.0
3.5 - 4.5
<3.5
>7.5
6.5 - 7.5
5.5 - 6.5
4.5 - 5.5
<4.5
>8.5
7.0 - 8.5
6.0 - 7.0
5.0 - 6.0
<5.0
>9.0
8.0 - 9.0
7.0 - 8.0
5.5 - 7.0
<5.5
>11.5
10.0 - 11.5
8.5 - 10.0
7.0 - 8.5
<7.0
10
5
0
0
5
10
15ms
-1
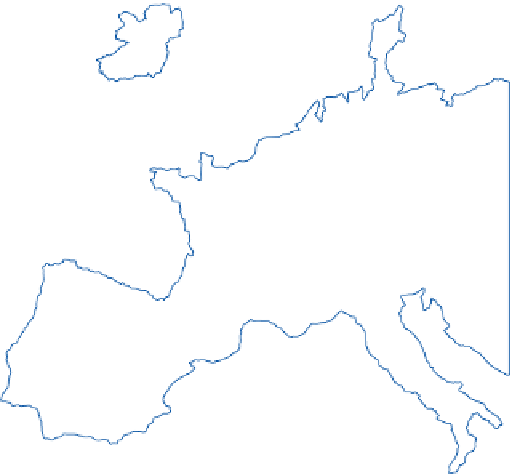
Figure 10.1
Average wind velocities (m s
-1
) over Western Europe, measured 50m above ground level for sheltered
terrain, open plains, sea coast, open sea and hilltops. Frequencies (percent) of wind velocities for 12 locations are
shown.
Source: From Troen and Petersen (1989). Courtesy Commission of the European Communities.
these limits. Some values in Europe are London
10, Berlin 21, and Moscow 42.
Figure 10.2
shows
the variation of this index over Europe.
An independent approach relates the frequ-
ency of continental air masses (
C
) to that of all air
masses (
N
) as an index of continentality, i.e.,
K
=
C
/
N
(percent).
Figure 10.2
shows that non-
continental air occurs at least half the time over
Europe west of 15
°
E as well as over Sweden and
most of Finland.