Geoscience Reference
In-Depth Information
of temperature, moisture and wind properties
at fronts, especially the warm front, are rather
uncommon. Such discontinuities are usually the
result of a pronounced surge of fresh, cold air in
the rear sector of a depression, but in the middle
and upper troposphere they are often caused
by subsidence and may not coincide with the
location of the baroclinic zone. In meteorological
analysis centers, numerous criteria are used to
locate frontal boundaries: 1000-500mb thickness
gradients, 850mb wet-bulb potential temperature,
cloud and precipitation bands, and wind shifts.
However, a forecaster may have to use judgement
when some of these criteria disagree.
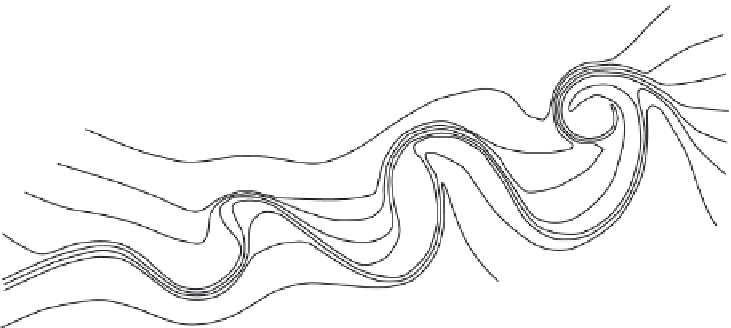
On satellite imagery, active cold fronts in a
strong baroclinic zone commonly show marked
spiral cloud bands, formed as a result of the
thermal advection (
Figure 9.8B, C
). A cirrus
shield, however, typically covers warm fronts. As
Figure 9.7 shows, an upper tropospheric jet stream
is closely associated with the baroclinic zone,
blowing roughly parallel to the line of the upper
front. This relationship is examined below.
Air behind the cold front, away from the low
center, commonly has an anticyclonic trajectory
and hence moves at a greater than geostrophic
speed (see Chapter 5A.4), impelling the cold front
to acquire a supergeostrophic speed also. The
(A)
Pressure, fronts and clouds
IV
III
L
II
L
I
L
L
(B)
Temperature and air currents
IV
III
II
WARM
I
Figure 9.9
Stages in the life-cycle of a marine extratropical depression showing I: incipient frontal
depression, II: frontal fracture, III: bent-back warm front and frontal T-bone, IV: warm-core seclusion. A:
Schematic isobars of sea-level pressure, fronts and cloud cover (stippled). B: Isotherms and flows of cold
air (solid arrows) and warm air (dashed arrows).
Source: After Shapiro and Keyser (1990). By permission of the American Meteorological Society.