Geoscience Reference
In-Depth Information
are fulfilled where there is slow divergent flow
from the major thermal and dynamic high
pressure cells. In contrast, low pressure regions
are zones of convergence into which air masses
move (see F, this chapter).
The major cold and warm air masses will now
be discussed.
km
T
0
10
T
1
T
1
T
2
WARM
AIR
5
T
2
T
3
COLD
AIR
T
3
T
4
T
4
Surface
South
1
Cold air masses
100-
200km
500-1000 km
North
The principal sources of cold air in the Northern
Hemisphere are (1) the continental anticyclones
of central-eastern Siberia and northern Canada
where continental Polar (cP) air masses form,
and (2) the Arctic Basin, when it is dominated by
high pressure in winter and spring (
Figure 9.2
).
Sometimes Arctic Basin air is designated as
continental Arctic (cA), but the differences
between cP and cA air masses are limited mainly
to the middle and upper troposphere, where
temperatures are lower in the cA air.
The snow-covered source regions of these two
air masses lead to marked cooling of the lower
layers (
Figure 9.3
). Since the vapor content of cold
air is very limited, the air masses generally have a
mixing ratio of only 0.1-0.5g/kg near the surface.
Figure 9.1
A schematic height cross-section for
the Northern Hemisphere showing barotropic air
masses and a baroclinic frontal zone (assuming
that density decreases with height only).
moisture, between the land or ocean surface and
the atmosphere, give rise to distinctive physical
properties of the overlying air through vertical
mixing. A degree of equilibrium between the
surface conditions and the properties of the over-
lying air mass will be achieved if the air remains
over a given geographical region for a period of
about three to seven days. The chief source regions
of air masses are necessarily areas of extensive,
uniform surface type that are overlain by quasi-
stationary pressure systems. These requirements
(A)
(B)
180°
0°
(mT)
mT
cT
mT
mP
mP
mixed
mT
mP
(cT)
cP
mT
cP
cA
cA
90°W
90°E
90°W
90°E
(mT)
mT
(cT)
mA
mP
mP
mixed
mT
mT
cT
cT
mT
cT
0°
180°
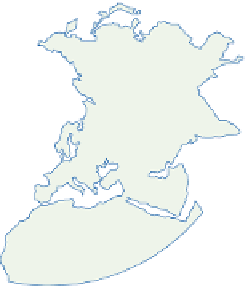
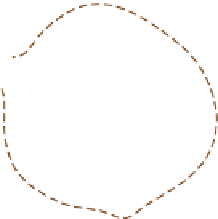
Figure 9.2
Air masses in winter. A: Northern Hemisphere; B: Southern Hemisphere.
Sources: A: After Petterssen (1950) and Crowe (1965). B: After Taljaard et al. (1969) and Newton (1972).