Geoscience Reference
In-Depth Information
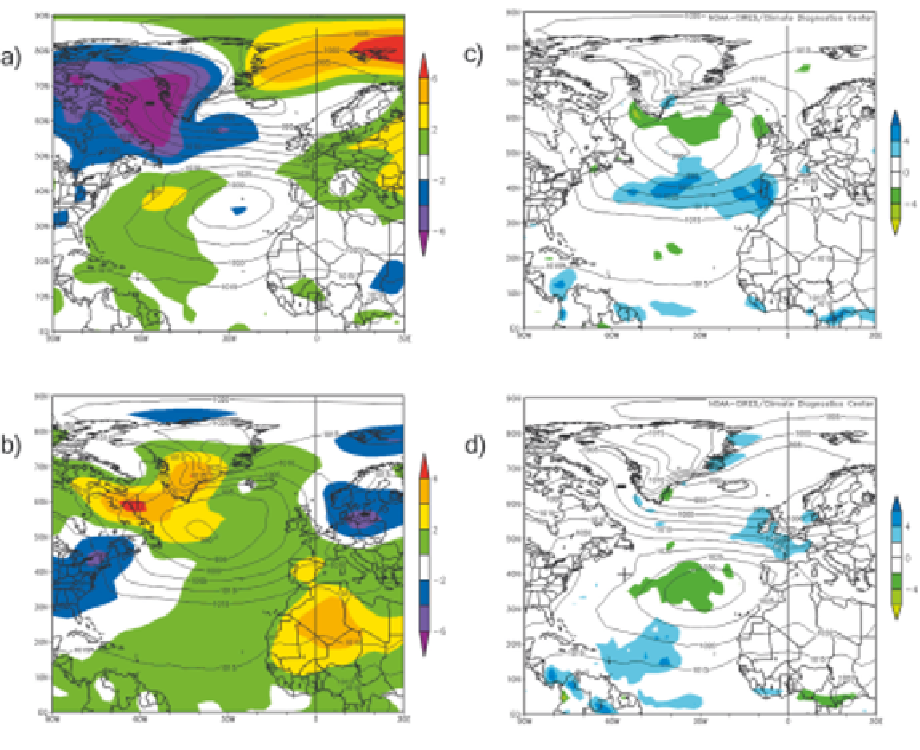
Plate 7.3
Illustration of the positive (January 1970) and negative (January 1984) phases of the North Atlantic
Oscillation and their associated temperature (A and B) and precipitation (C and D) anomalies. MSL isobars at 5mb
intervals; anomalies of temperature at 2°C intervals; and of daily precipitation rate at 2mm/day.
Source:Climate Diagnostics Center, NOAA, CIRES, Boulder, CO.
similarity to a corresponding oscillation of mass
between the high and mid-latitudes of the
Southern Hemisphere, known as the Antarctic
Oscillation (AAO) or Southern Annular Mode
(SAM). In comparison with the NAM, the mass
oscillation associated with the SAM is much more
zonally symmetric, or annular; that is, the mass
oscillation is more clearly seen at all longitudes.
The thinking is that if it were not for the distorting
influences of orography and land-sea contrasts,
the NAM would also show a fairly symmetric
pattern rather than be dominated by variability in
the Atlantic sector, with a much weaker center of
action in the North Pacific. In other words, like the
SAM, the NAM is 'inherently' a symmetric
pattern, the departures from this symmetry
due to the distorting effects mentioned above.
Regardless, time series from the NAM and NAO.
are highly correlated, and for many applications,
may be viewed as different definitions of the same
thing. The NAM and SAM patterns extend
upward throughout the troposphere.
Based on sea-level pressure records, time series
of the NAO index have been compiled back to