Geoscience Reference
In-Depth Information
Figure 5.1
, the lifting condensation level is at
860mb with a temperature of 8
the surface air temperature from
T
0
to
T
1
,
T
2
and
T
3
(
Figure 5.4
). Convection also equalizes
the humidity mixing ratio, assumed equal to the
value for the initial temperature. The CCL is
located at the intersection of the environment
temperature curve with a saturation mixing
ratio line corresponding to the average mixing
ratio in the surface layer (1000-1500m). Express-
ed in another way, the surface air temperature
is the minimum that will allow cloud to form
as a result of free convection. Because the air
near the surface is often well mixed, the CCL
and LCL, in practice, are commonly nearly
identical.
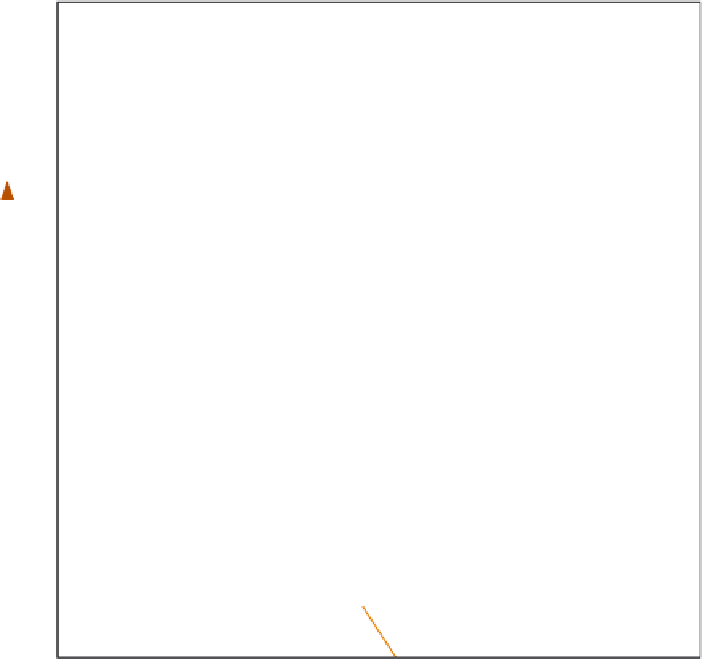
C. The height of
this 'characteristic point' is approximately
°
h
(m) = 120(
T
-
Td
)
where
T
= air temperature and
Td
= dew-point
temperature at the surface in
C.
The lifting condensation level (LCL) formu-
lation does not take account of vertical mixing.
A modified calculation defines a
convective con-
densation level
(CCL). In the near-ground layer,
surface heating may establish a superadiabatic
lapse rate, but convection modifies this to the
DALR profile. Daytime heating steadily raises
°
ENVIRONMENT
CURVE
Height
pressure
CONVECTIVE
CONDENSATION LEVEL
SATURATED
MIXING
RATIO
DALR
T
0
T
1
T
2
T
3
Temperature
Figure 5.4
Schematic adiabatic chart used to determine the convective condensation level (see p. 113).
T
0
represents the early morning temperature; T
1
, T
2
and T
3
illustrate daytime heating of the surface air.