Geoscience Reference
In-Depth Information
10
5
2
1
A
0.5
B
0.2
0.1
10
20
50
100
200
500
1000
2000
5000
10000
Area (km
2
)
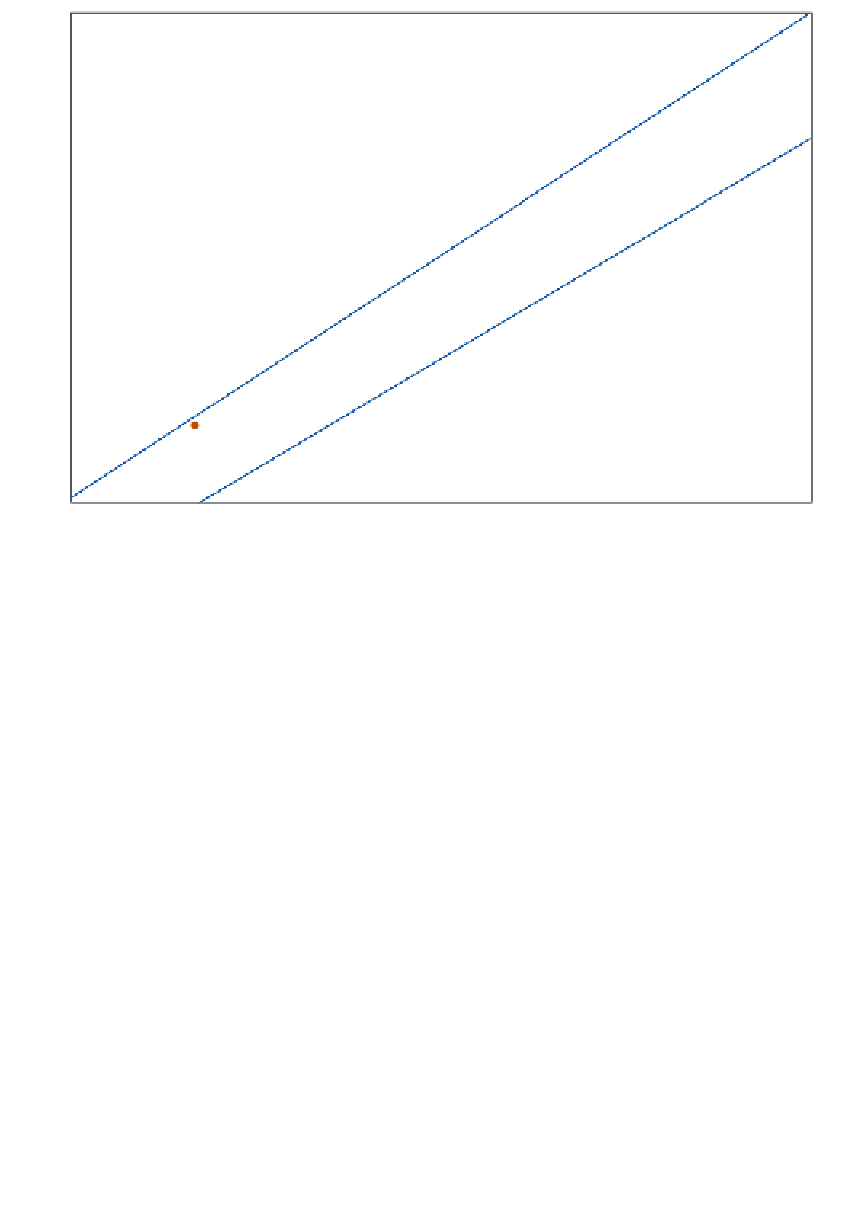
Figure 4.13
The relationship between area (km
2
) and frequency of occurrence, during a five-year period,
of rainstorms that produce A: 25-year and B: 100-year or heavier rain amounts for 6-12-hour periods over
50 percent or more of each area in Illinois.
Source: S.A. Chagnon (2002). From Journal of Hydrometeorology by permission of the American Meteorological Society.
occur in the twentieth year of a selected period.
Indeed, they may occur in the first or not at all!
These estimates require long periods of obser-
vational data, but the approximately linear
relationships shown by such graphs are of great
practical significance for the design of flood-
control systems, dams and reservoirs.
Studies of rainstorm events have been carried
out in many different climatic areas. An example
for southwest England is shown in
Figure 4.15
.
The 24-hour storm had an estimated 150-200-
year return period. By comparison, tropical
rainstorms have much higher intensities and
shorter recurrence intervals for comparable totals.
A glance at the maps of precipitation amount
for December to February and June to August
(
Figure 4.16
) indicates that the distributions are
considerably more complex than those, for
example, of mean temperature (see
Figure 3.11
).
Comparison of
Figure 4.16
with the meridional
profile of average precipitation for each latitude
(
Figure 4.17
) brings out the marked longitudinal
variations that are superimposed on the zonal
pattern. The zonal pattern has several significant
features:
1
The 'equatorial' maximum, which is displaced
into the Northern Hemisphere. This is related
primarily to the converging Trade Wind
systems and monsoon regimes of the summer
hemisphere, particularly in South Asia and
West Africa. Annual totals over large areas are
of the order of 2000-2500mm or more.
3
The world pattern of precipitation
Globally, 79 percent of total precipitation falls on
the oceans and 21 percent on land (
Figure 4.1
).