Geoscience Reference
In-Depth Information
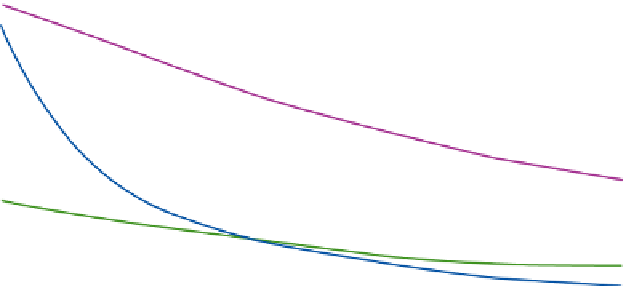
40
April
30
20
June
December
10
0
0
20
40
60
80 100
Duration of storm (minutes)
120
140
160
180
Figure 4.10
Relation between rainfall intensity and duration for Milwaukee, USA, during three months
in 1973.
Source: US Environmental Data Service (1974). Courtesy US Environmental Data Service.
50000
50000
25000
25000
HOKITIKA, NZ
10000
10000
BARIL REUNION
CHERRAPUNJI, INDIA
5000
5000
COMMERSON REUNION
2000
2000
CILAOS REUNION
BELOUVE REUNION
1000
1000
SMETHPORT, PA
D HANIS, TEXAS
HILO,HI
500
500
ROCKPORT, W VA
HOLT, MO
CURTEA DE ARGES, ROMANIA
PLUMB POINT, JAMAICA
FUSSEN, BAVARIA
200
200
100
100
50
50
UNIONVILLE, MD
25
1246 0
25
20
40 60
3
6
12
24
5
10
20 30
2
3
6
12
24
Minutes
Hours
Days
Months
Figure 4.11
World record rainfalls (mm) with an envelope line prior to 1967. The equation of the line is given and
the state or country where important records were established.
Source: Modified and updated after Rodda (1970). Courtesy of the Institute of British Geographers.