Geoscience Reference
In-Depth Information
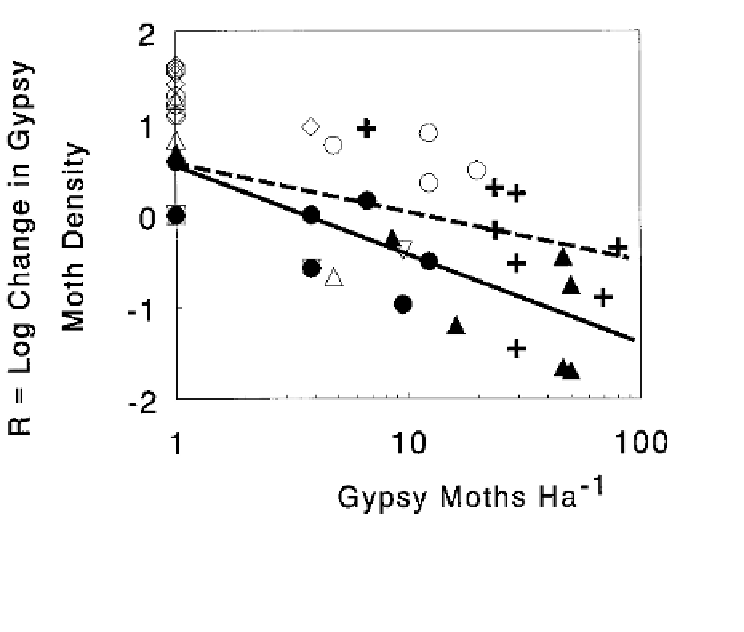
Figure 6.1
Change in gypsy moth density (R= log
10
[N
t+1
/N
t
]).plotted against gypsy moth density
(N
t
) compared to slope (dotted line) expected with no density dependence (Elkinton et al. 1996).
Solid line is regression equation fit to the data. Values of R < 0 indicate declining densities; values of
R> 0 indicate increasing densities. Densities are estimated egg masses per hectare.
in the same direction would density dependence be confirmed. Their ap-
proach has been subsequently shown to be extremely conservative, such that
very few data sets would pass the test (Holyoak 1993).
Pollard et al. (1987) proposed a so-called randomization test that has
emerged in several comparisons as the most accurate and powerful of extant
methods (Holyoak 1993). They calculated a null distribution of slopes (i.e.,
those expected if there were no density dependence) to compare against the
slope obtained from the actual data. This was done by generating a large num-
ber (e.g., 1,000) of permutations of the list of successive annual census data
values. Because the data values were scrambled in this way, the dependence of
each value on the preceding value was obliterated, yet the overall variance of
the densities was retained. For each permutation they regressed
R
versus
X
t
and
then compared the slope from the actual data with the distribution of slopes
obtained from the 1,000 permutations. Reddingius (1971) proposed a very
similar test.